
 Home
Home News
News
- 1 BTT price showed a massive fall and stayed in the sellers’ grip.
- 2 Bears look strong and persist in adding short positions.
BitTorrent (BTT) price persisted in dragging the gains, suggesting past sessions were bearish. Moreover, the price action shows strong correction over the past months and could not manage to hold the support regions. BTT price persists in crashing the clusters shows strong selling pressure and bears persisted in adding short positions.
BTT price is trading below the significant moving averages and showed correction in the past sessions. BTT lost over 58% gains showing extreme downfall and failed to hold and slip consistently. Moreover, BTT could not manage to hold and attain a pullback, forming lower lows. If price falls below $0.0000003800, it will go toward $0.0000003500 in the following sessions.
BitTorrent price is signaling seller dominance and that bulls faced pressure in the past few sessions. Moreover, the battle is clearly one sided as the sellers dominated the bulls, making short positions and dragging the price lower.
At press time, BTT price was trading at $0.0000003887 with an intraday gain of 0.20% showing bearishness on the charts. Moreover, the trading volume increased by 2.67% to $7.88 Million showing less investors interest for the past sessions. Moreover, the pair of BTT/BTC is at 0.0000000000147 BTC; the market cap of BTT is $372.14 Million. Furthermore, analysts maintained a strong sell rating and suggested a significant downside for the upcoming sessions.
BTT Price Action Showing Bearishness on Daily Charts
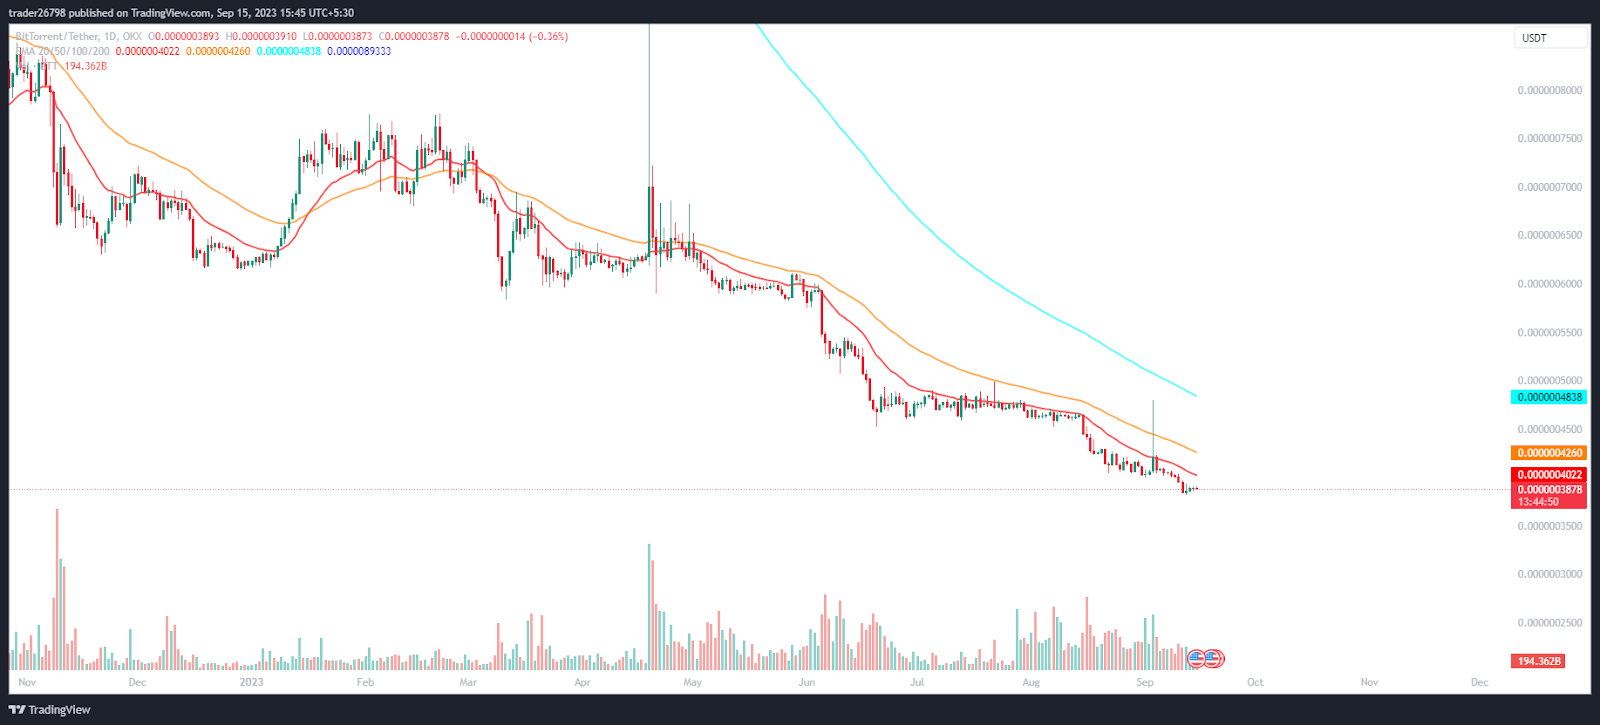
On the daily charts, BTT price showcased a downtrend and persisted in losing the gains without pausing. Moreover, the fall indicates massive short buildup activity. Sellers looked aggressive over the past few sessions. Furthermore, there were no signs of recovery as per the technicals, suggesting further follow-on selling pressure will continue and that BTT may face headwinds in the upcoming sessions.
What Technical Indicators Say?

On the 4 hour charts, BTT price showcased consolidation and attempted a pullback. It is hovering in a narrow range. However, the technicals are giving neutral signals, instead of bearishness. BTT chart may show a rebound in the coming sessions.
The RSI curve stayed near neutrality and showcased a bearish divergence suggesting volatility in the past sessions.
The MACD indicator showcased a bullish crossover and formed green bars on the histogram suggesting a rebound may show in the coming sessions.
Summary
BTT price is in a downtrend. Moreover, the price action indicates short buildup activity and suggesting further selloff can be anticipated below $0.0000003500. Conversely, if BTT attains a pullback, the immediate swing hurdle of $0.0000004000 needs to be surpassed to extend the gains.
Technical Levels
Support Levels: $0.0000003800 and $0.0000003500
Resistance Levels: $0.0000004000 and $0.0000004200
Disclaimer
The views and opinions stated by the author or any other person named in this article are for informational purposes only and do not constitute financial, investment, or other advice. Investing in or trading crypto or stocks comes with a risk of financial loss.

With a background in journalism, Ritika Sharma has worked with many reputed media firms focusing on general news such as politics and crime. She joined The Coin Republic as a reporter for crypto, and found a great passion for cryptocurrency, Web3, NFTs and other digital assets. She spends a lot of time researching and delving deeper into these concepts around the clock, and is a strong advocate for women in STEM.


