
 Home
Home News
News
- 1 DIS stock price shows a falling wedge pattern on the charts.
- 2 Buyers are losing strength and faced rejection from the 200-day EMA.
Walt Disney (NYSE: DIS) stock price shows rejection from the 200 day EMA, profit booking was seen in the past trading sessions. Moreover, the price action highlights selling pressure, bears are trying to stretch the fall below the critical support zone of $80. Furthermore, the chart structure showcased lower lows formation, indicating short buildup activity which creates pressure on bulls resulting in rejection from the round mark of $100.
DIS share price is trading near the primary support of $80, at a make or break level, where if price sustains near the lower trendline, a rebound toward the 200 day EMA near $90 can be anticipated. At the moment, DIS stock price is trading at 20 day EMA and trying to sustain above it. Conversely, if price slips below $80, correction may extend toward $70.
At press time, DIS stock price was trading at $84.48 with an intraday gain of 1.20%, showing a neutral chart structure. Moreover, the trading volume increased by 1.09% to 23.676 Million and the market cap is $154.371 Billion. Moreover, Analysts maintained a neutral rating with a yearly target price of $108.71 suggesting a significant uptick in the coming sessions.
The Walt Disney Co. engages in the business of international family entertainment and media enterprise. It owns and operates television and radio production, distribution and broadcasting stations, direct-to-consumer services, amusement parks, and hotels. It operates through the following business segments: Disney Entertainment, ESPN, and Disney Parks, Experiences, and Products. The company was founded by Walter Elias Disney on October 16, 1923 and is headquartered in Burbank, CA.
DIS Stock Price Action On Daily Charts
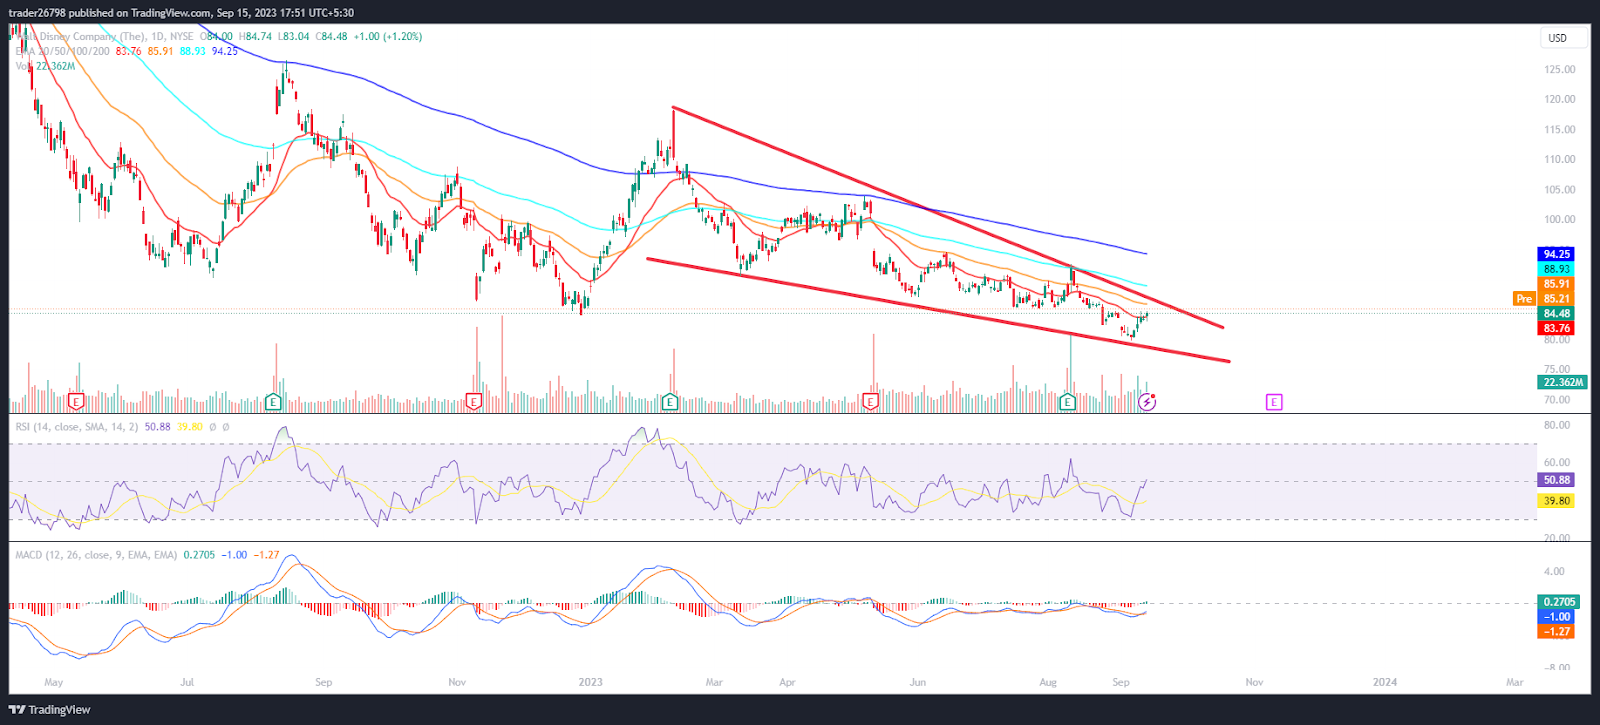
On the daily charts, DIS stock price shows a falling wedge pattern and is hovering near the 20 day EMA indicating that past sessions had a slightly negative outlook. Moreover, the chart structure indicates a lower lows formation and bulls failed to surpass the 200 day EMA and round mark of $100 and showed rejection results in retracement in the past week.
The RSI curve stayed near neutrality and showed a positive crossover indicating that buyers are looking for a pullback, and might be interested in retesting the swing of $100 soon.
The MACD indicator showed a bullish crossover and formed green bars on the histogram suggesting an up move toward the 200 day EMA soon.
Summary
Walt Disney (DIS stock) price is trading near the crucial support zone and is close to the lower trendline of $80. Furthermore, DIS stock showed a rejection from the 200 day EMA and retraced toward the support region. However, the bulls persisted in accumulation and might be interested in pullback to retain the swings of $100 in the next sessions.
Technical Levels
Support Levels: $80 and $75
Resistance Levels: $90 and $100
Disclaimer
The views and opinions stated by the author or any other person named in this article are for informational purposes only and do not constitute financial, investment, or other advice. Investing in or trading crypto or stocks comes with a risk of financial loss.

With a background in journalism, Ritika Sharma has worked with many reputed media firms focusing on general news such as politics and crime. She joined The Coin Republic as a reporter for crypto, and found a great passion for cryptocurrency, Web3, NFTs and other digital assets. She spends a lot of time researching and delving deeper into these concepts around the clock, and is a strong advocate for women in STEM.


