
 Home
Home News
News
- 1 Flow price took resistance and decreased by 6.57% over the last month.
- 2 The price of the Flow is trading at $0.455 and the 52-week range is $0.391 – $2.058.
FLOW crypto announced its support for the LearnWeb3DAO D.I. Hackathon, which is open for registration now. The hackathon is organized by LearnWeb3DAO, a decentralized learning community for Web3 and AI enthusiasts. The hackathon challenges participants to build Web3 and AI projects in two weeks.
The hackathon offers $50K in prizes for the best projects, as well as mentorship and support from them and other sponsors. The hackathon aims to foster collaboration and learning among Web3 and AI developers and enthusiasts, as well as showcase the potential of their platform for creating and deploying crypto games and apps.

Flow rose by 7.65% in market value and by 71.61% in trading volume in the last 24 hours, per Coinmarketcap which is a crypto data and info website. Its market value is $470,947,459 and its trading volume is $41,008,844. There are 1,036,200,000 FLOW in circulation
Technical Analysis of FLOW on 1-D Timeframe
Flow price has been on a downtrend for the last 52 weeks, losing 74.06% of its value. The price makes lower peaks and valleys, indicating a downtrend.
The Flow price is now at $0.455 and facing a downward trendline that has been a resistance since November 2022. The price is also under the 20 and 50-day EMAs, which have more resistance levels.
FLOW price could bounce back if it breaks above the downward trendline and the EMAs. Then, the next probable resistance levels could be $0.539 and $0.608, based on the previous highs and lows.
The Flow price could drop further and continue its usual trend of rising small and selling big if it fails to break the current resistance and keeps falling. The next support levels could become $0.436 and $0.400.
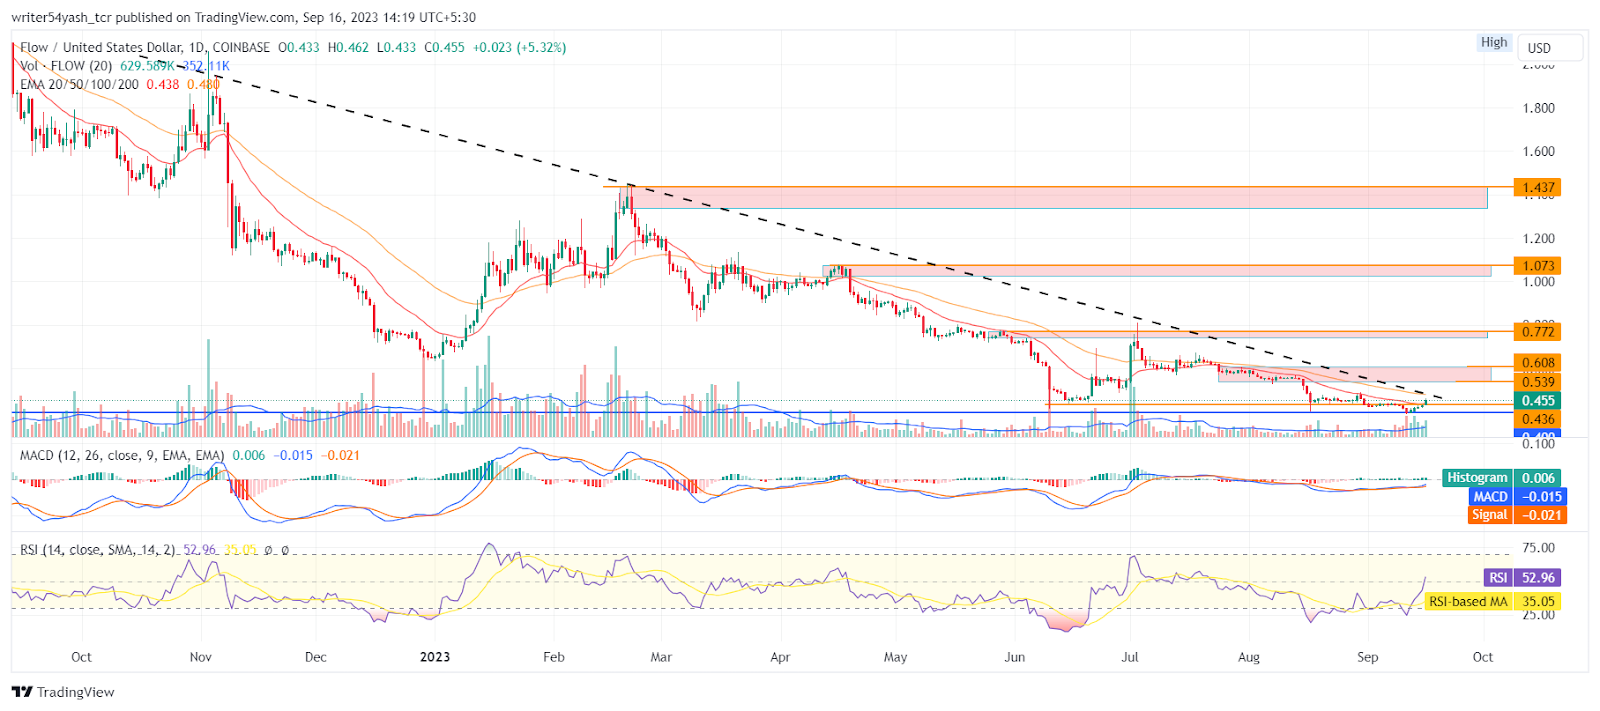
At the time of publishing, the Flow price (FLOW) is trading between the 20 and 50-day EMAs (exponential moving averages), which one is rejecting and the other is trying to support the Flow price trend.
The MACD line at 0.015 and the signal line at 0.021 are below the zero line and both lines crossed each other multiple times but the histogram gap is lean in the MACD oscillator, highlighting traits of lack of momentum in the FLOW crypto’s market.
The current value of the RSI is 52.24 points and the 14-day SMA is below the median line at 35.00 points indicating neeutral sentiment. Collectively, the indicators view is consolidation to bearish.
Conclusion
FLOW price prediction shows a neutral to bearish outlook from investors and traders in the daily time frame. FLOW price action reveals a neutral to downward trend at the time of writing. Moreover, the daily chart shows the price trend is uncertain, as the technical indicators suggest. The RSI, EMA, and MACD are the most reliable and popular tools for analyzing the market. They indicate that the price may either stay in a range or continue to decline.
Technical Levels:
- Support levels: $0.436 and $0.400
- Resistance levels: $0.539 and $0.608
Disclaimer
In this article, the views and opinions stated by the author, or any people named are for informational purposes only, and they don’t establish the investment, financial, or any other advice. Trading or investing in cryptocurrency assets comes with a risk of financial loss.

Nancy J. Allen is a crypto enthusiast, with a major in macroeconomics and minor in business statistics. She believes that cryptocurrencies inspire people to be their own banks, and step aside from traditional monetary exchange systems. She is also intrigued by blockchain technology and its functioning. She frequently researches, and posts content on the top altcoins, their theoretical working principles and technical price predictions.


