
 Home
Home News
News
- 1 Polkadot Price Prediction suggests that the downfall will take a halt soon.
- 2 DOT price is near to the multi-year low.
- 3 Polkadot crypto price is in a downtrend.
Polkadot price prediction suggests that the DOT crypto has corrected a lot so a pullback rally is pending. DOT price looks oversold and trading near to the demand zone, so buyers seem to be trying their best to rebound.
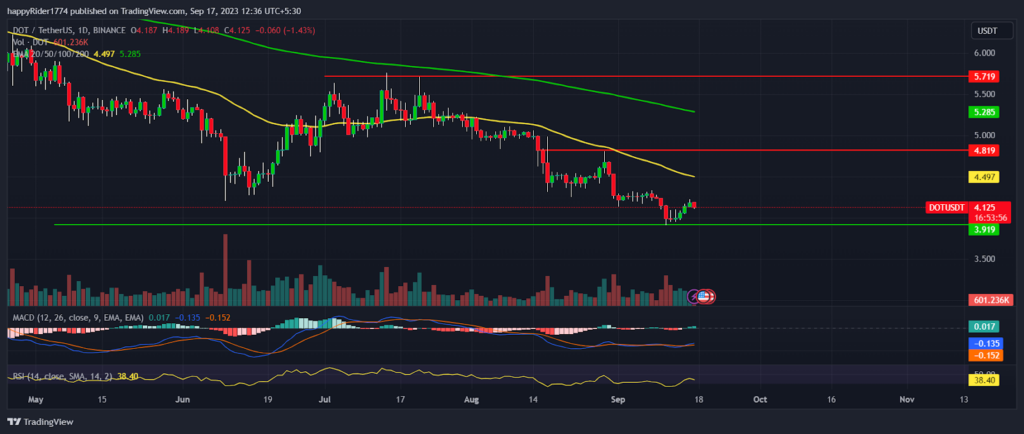
Polkadot price is trading below the downward-sloping 50-day and 200-day EMA. It showcases that crypto is in a downtrend and bears are active on higher levels.
DOT prices formed a bearish pattern and declined by forming lower low swings. It eroded the gains generated in the past few months and dropped below the yearly lows. However, the price did not collapse much and is still trying to regain the $4.500 level.
Recently, the Polkadot crypto price took support near $4.00 and showed a minor bounce. But the up move was not strong so it will be difficult to interpret whether the recovery will continue or not.
As of now no strong signs of reversal are visible so the prices are in a bearish grip. However, if any pullback comes and buyers are able to push the price above the 50-day EMA, then we may see a short-term trend reversal.
Will the Downfall in Polkadot Price Halt Near $4?
Polkadot price prediction is bearish for the short term till prices are trading below $4.500.
The sellers look more active as compared to buyers so it will be difficult for the bulls to break the $4.500 hurdle. However, if the crypto market recovers then it may positively impact DOT crypto in the coming months.
Presently, Polkadot price is trading at $4.125 with an intraday decline of -1.43%. The 24-hour volume to market cap is 1.38%.
Till the DOT price sustains above $4.00 it will be risky to create further shorts. It has already corrected a lot from its recent swing high. So a short squeeze may trigger any time to clear out previous shorts.
DOT Price Chart Looks Bearish on Multiple Time Frames
DOT price is forming bearish patterns on multiple time frames. The pair of DOT/BTC is trading at 0.0001552 with an intraday decline -1.52%.
The pattern of both the pairs looks similar and seller dominance is visible. So, investors must wait for the price to climb above $4.500 before creating any positions.
The MACD curve sloping sideways denoting price may spend some time in consolidation. The RSI at 37 denotes weakness but it is near to oversold territory so bounce back is possible.
Conclusion
Polkadot price prediction suggests DOT crypto is near to the demand so a short-term bounce is possible. The analysis suggests, the downfall may take a halt near $4 but buyers will gain confidence when prices climb above the $4.500 level.
Technical levels
- Resistance levels: $4.800 and $5.700
- Support levels: $3.900 and $3.500
Disclaimer
The views and opinions stated by the author, or any people named in this article, are for informational purposes only. They do not establish financial, investment, or other advice. Investing in or trading crypto assets comes with a risk of financial loss.
Mr. Pratik chadhokar is an Indian Forex, Cryptocurrencies and Financial Market Advisor and analyst with a background in IT and Financial market Strategist. He specialises in market strategies and technical analysis and has spent over a year as a financial markets contributor and observer. He possesses strong technical analytical skills and is well known for his entertaining and informative analysis of the Financial markets.


