
 Home
Home News
News
- 1 Goldman Sachs’ stock price gained 4.39% in the last week.
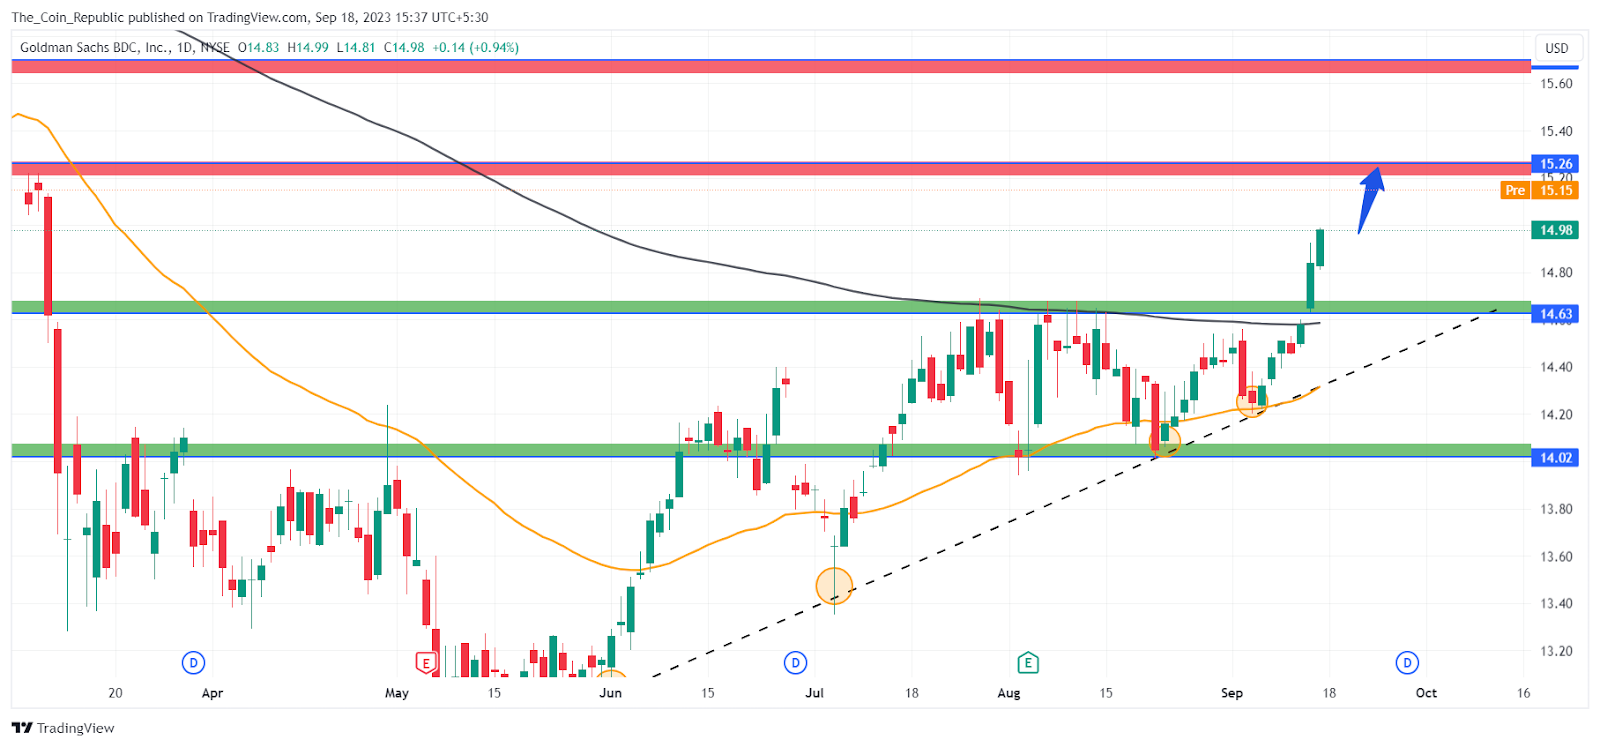
- 2 The daily chart shows the breakout of the 200 EMA after a 60-day consolidation.
- 3 The GSBD stock price might continue to surge with the momentum in Monday’s session.
Goldman Sachs’ stock price prediction demonstrates that the stock has registered a breakout of the $14.5 level and has gained nearly 3% in the last 2 sessions of the preceding week. The breakout is supported by a rising volume which adds genuineness to the breakout and the price might continue with the momentum in Monday’s session.
The daily chart shows that the price showed a consolidation of over 60 days followed by a breakout above $14.63. Moreover, the daily chart also demonstrates a shift in the price trend from bearish to bullish.
The technical indicators imply that the price has shown a breakout of the 200-EMA; shifting its long-term trend to bullish. The GSBD price took multiple supports from the 50-day EMA to make a breakout and surge higher.
Goldman Sachs BDC invests in middle-market companies located in the United States. The company holds a market cap of $1.641 Billion. The company has a good dividend yield of 12%. The volume analysis shows that the stock received a trading volume of $566.88K on Friday which is more than the 10-day average volume received.
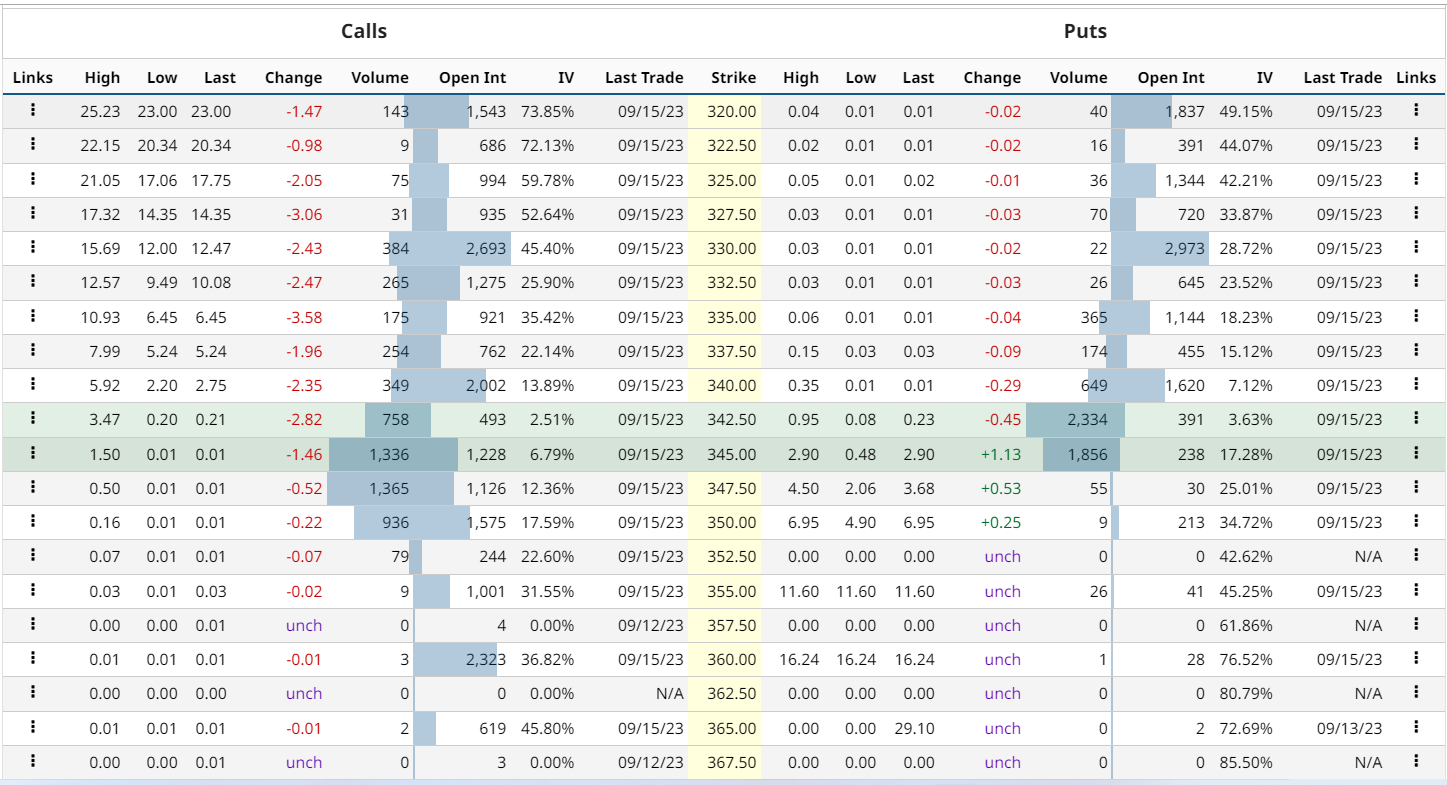
Goldman Sachs stock derivatives data analysis states that the current implied volatility in the market is 21.29% with an increment of 1.38% in the last trading session. The at-the-money strike price has 391 open contracts on the PUT side and 493 open contracts on the CALL side indicating that none of the buyers and sellers are dominating the trend at the moment.
Goldman Sachs Stock Price Prediction Over Daily Chart
Currently, Goldman Sachs’ stock price is trading at $342.54 and has witnessed a breakout of the 200-day EMA. The price prediction states that the price has entered bullish territory and it might continue with the momentum to surge higher in Monday’s session.
The bears have lost control over the trend and have to wait for the price to decline below the 200-day EMA again or they have to wait for the price to show a bearish price action over the daily timeframe.
Technical Indicators Show Volatility in the Short-Term

The technical indicators including RSI and MACD opinion rating for the stock is a 16% “buy” with a weakening short-term outlook on maintaining the current trend. The market trades in an overbought territory where it might face profit booking.
Conclusion
Goldman Sachs stock price has broken out of a long-term consolidation and a 200-day EMA, indicating a bullish trend. The breakout is backed by high volume and a good dividend yield of 12%. The company invests in middle-market companies in the US and has a market cap of $1.641 Billion. The price prediction suggests that the stock will continue to rise in Monday’s session. The bears have to wait for the price to fall below the 200-day EMA or show a bearish signal to regain control.
Technical Levels
- Support levels: $14.63 and $14.02
- Resistance levels: $15.26 and $15.70
Disclaimer
The views and opinions stated by the author, or any people named in this article, are for informational purposes only and do not establish financial, investment, or other advice. Investing in or trading crypto or stock comes with a risk of financial loss.

Nancy J. Allen is a crypto enthusiast, with a major in macroeconomics and minor in business statistics. She believes that cryptocurrencies inspire people to be their own banks, and step aside from traditional monetary exchange systems. She is also intrigued by blockchain technology and its functioning. She frequently researches, and posts content on the top altcoins, their theoretical working principles and technical price predictions.


