
 Home
Home News
News

- 1 Microsoft stock is above the strong trendline support that has been in place for the last nine months.
- 2 The stock has gained 2.94% in the past month, showing a positive momentum.
- 3 Microsoft Corporation (NASDAQ: MSFT) stock’s 52-week price range is between $213 – $366.
Microsoft’s earnings grew by 20.8% per year in the past five years and is expected to grow by 11.9% per year in the future, which is above the savings rate of 2.2%. Its revenue is also forecasted to grow faster than the US market, at 11.1% per year versus 7.8%.

Based on the data from Simply Wall St., Its return on equity is 35.1%, which indicates that it is efficient in using its shareholders’ funds. MSFT is undervalued based on its price-to-earnings ratio, which is 33.9x compared to the estimated fair value of 65.5x and the industry average of 45.2x.

According to Simply Wall St., two individuals who are executives of MSFT stock sold a large number of shares in August and September 2023.
Brad Smith, the president and vice chairman, sold about 50,000 shares on August 1st, and Kathleen Hogan, the head and chief officer of human resources and executive vice president, sold about 26,815 shares on September 1st. The total value of the shares sold was around $25.5 Million.
MSFT stock is a financially strong and profitable company that is undervalued by the market. It has more cash than debt which lowers its default risk. It also improved its capital structure by reducing its debt-to-equity ratio from 92.2% to 22.9% in the past five years.
According to Simply Wall St., MSFT stock has a high growth potential and a competitive advantage in the software industry. It can easily service its debt with its operating cash flow, which is 185.4% of its debt. It also earns more interest than it pays, so it does not have to worry about the cost of borrowing.
MSFT Stock Price Technical Analysis in 1-D Timeframe
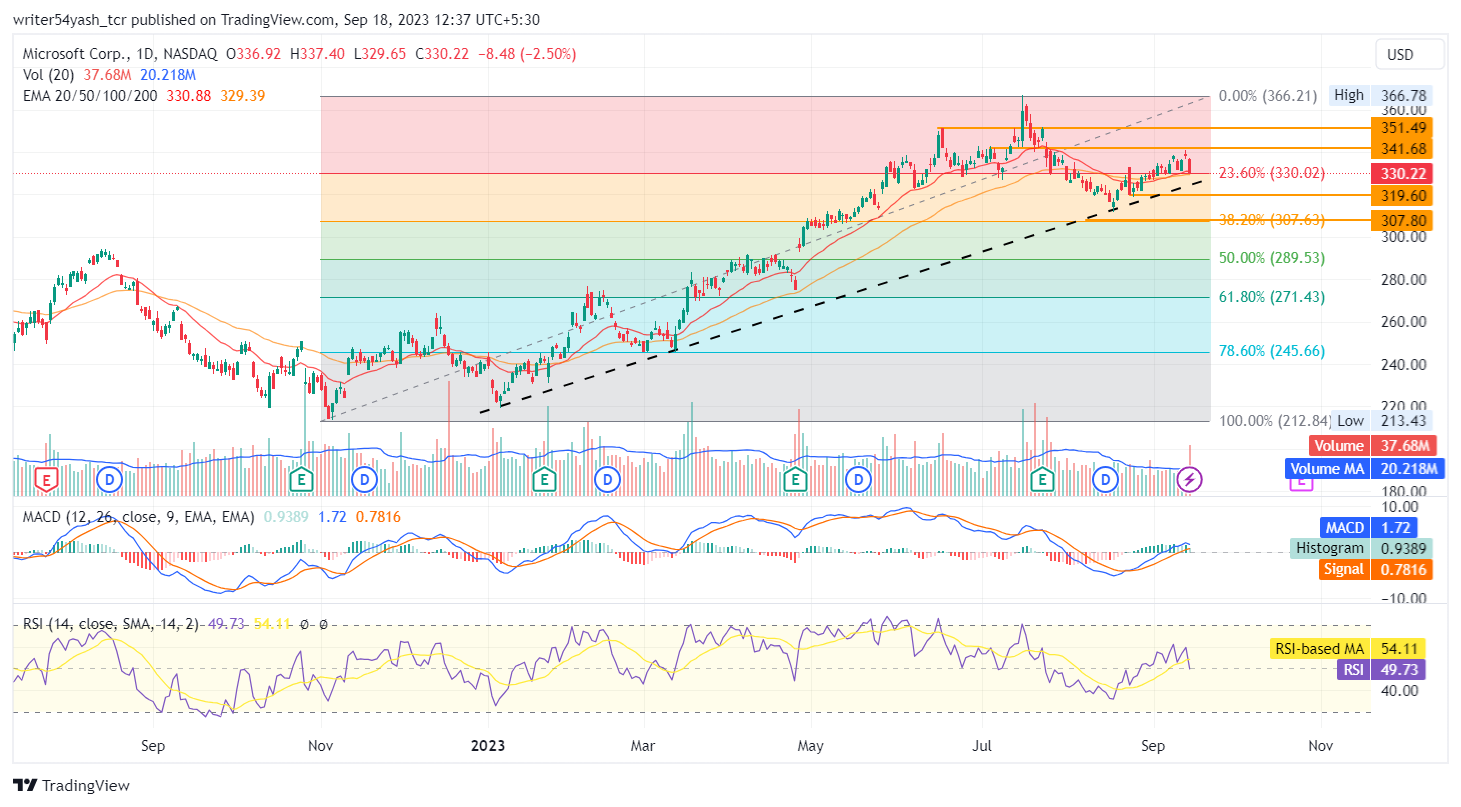
MSFT stock has been on a strong uptrend since 2023, attracting buyers. However, it faced some selling pressure near the supply range and retraced in the last few weeks to around $310, which coincides with the 38.20% Fibonacci level.
MSFT stock reported its quarterly results for June 2023 on July 25th, 2023. It beat the expectations by earning $2.69 per share on $56.19 Billion of revenue and $20.08 Billion of net income.
MSFT stock expects to earn $2.633 per share on $54.5 Billion of revenue for the next quarter ending in September 2023. It will announce its results on October 25th, 2023.
MSFT stock price rose from $213 to $366 since November 2022, following the Fibonacci levels. It is currently trading at $330.22. It encountered some resistance and profit-taking and dropped to $310, where it found support at the 38.20% Fibonacci level and a strong trendline.
It could rise to $341 or $351, the next resistance level, if it maintains the trendline support. But if it breaks below $319 or the trendline with momentum, it could fall to the major support level of $307 or lower.
MSFT stock is trading between the 20 and 50-day EMA. RSI is around 50, indicating a neutral sentiment. MACD histogram is not expanding in the bullish cross.
Overall, the stock is fundamentally sound but has experienced some price correction due to profit-taking. It is showing signs of accumulation, so the outlook is neutral to bullish.
Most MSFT shares (72.2%) are owned by institutions while the general public owns 27.7%. The state or government, individual insiders, and private companies own very small fractions of 0.04%, 0.03%, and 0.005%, respectively. The shareholders’ ownership has not changed significantly in the last year. The largest shareholder is the Vanguard Group Inc., which owns 8.79% of the company, worth $215.7 Billion.
Summary
Microsoft Corporation (NASDAQ: MSFT) stock price is showing a bullish trend and the stock has managed to ride on the trendline for the past 52 weeks. However, the technical indicators are giving consolidation to bullish views as long as it is above the trendline but the scenario can reverse if MSFT stock slips the trendline and declines.
Technical Levels
- Support levels: $319 and $307
- Resistance levels: $341 or $351
Disclaimer
In this article, the views and opinions stated by the author, or any people named are for informational purposes only, and they don’t establish the investment, financial, or any other advice. Trading or investing in cryptocurrency assets comes with a risk of financial loss.

Nancy J. Allen is a crypto enthusiast, with a major in macroeconomics and minor in business statistics. She believes that cryptocurrencies inspire people to be their own banks, and step aside from traditional monetary exchange systems. She is also intrigued by blockchain technology and its functioning. She frequently researches, and posts content on the top altcoins, their theoretical working principles and technical price predictions.


