
 Home
Home News
News
- 1 RTX stock price fell 11.90% in the current month.
- 2 RTX Corp. stock price hit a 52-week low at $73.62.
- 3 The trend in the RTX share price is in a downward direction.
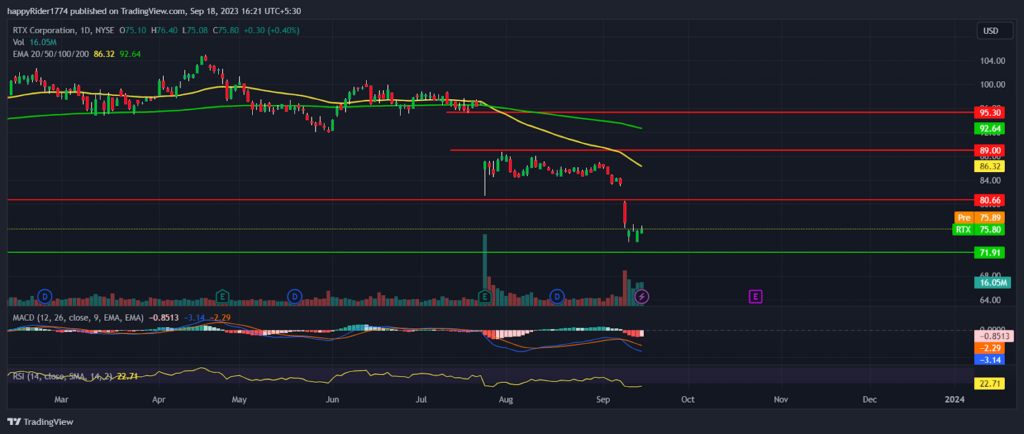
RTX stock price fell 11.90% in September 2023 and eroded a big portion of the market capitalization. It broke the crucial support of $80.00 with a massive gap down which triggered a panic sell-off in the stock.
RTX stock price dropped below the 50-day and 200-day EMA showcasing a downtrend. However, the prices look highly oversold so a wild short squeeze may trigger anytime.

In August, RTX share price traded in the range between $80.00 to $90.00. Buyers have tried their best to defend the lower range but they did not succeed. The recent gap broke the lower range and caused a further decline.
Meanwhile, the selling volume increases which shows that some big investors may have exited at higher levels.
RTX share price is trying to take support near $73 but fresh buyers look reluctant to build long positions. It has corrected a lot in a short period of time so a minor pullback or a narrow-range consolidation is possible.
RTX stock price closed the previous session at $75.80 with an intraday rise of 0.40%. The market capitalization stands at $110.33 Billion.
Will RTX Stock Price Show a Pullback Rally?
RTX stock price is in the correction phase and sellers are continuing their dominance on the higher levels. It forms a highly bearish pattern on a multiple time frame and no signs of recovery are visible.
Aerospace and defense sectors stocks had witnessed profit booking so it may trade with a bearish bias for some more time.
Till RTX share price trades below $80.00, it is expected to remain in the bears’ grip. Any short-term bounce will not be reliable until buyers succeed in breaking the $80.00 hurdle.
RTX Stock Price on a Weekly Time Frame
RTX stock price formed a giant bearish candle on a weekly time frame. It shows that sellers are active and more downside is possible. The broader market indices are also mildly bearish which may negatively impact the other stocks.
The MACD curve displayed a sharp negative crossover and the histogram bar is declining. It indicates bearishness may continue for some more time. The RSI at 22 is highly oversold so short sellers must be careful.
Conclusion
RTX stock price fell 11.90% in September 2023 and formed a bearish pattern on multiple time frames. The analysis suggests that the RTX share price is in a correction phase and more downside is pending.
Technical Levels
- Resistance levels: $80.00 and $90.00
- Support levels: $71.00 and $65.00
Disclaimer
The views and opinions stated by the author, or any people named in this article, are for informational purposes only. They do not establish financial, investment, or other advice. Investing in or trading crypto assets comes with a risk of financial loss.
Mr. Pratik chadhokar is an Indian Forex, Cryptocurrencies and Financial Market Advisor and analyst with a background in IT and Financial market Strategist. He specialises in market strategies and technical analysis and has spent over a year as a financial markets contributor and observer. He possesses strong technical analytical skills and is well known for his entertaining and informative analysis of the Financial markets.


