
 Home
Home News
News

- 1 ADA price shows range-bound moves and is waiting for a bounce.
- 2 Buyers are holding the gains and looking to surpass the 20-day EMA spot.
Cardano (ADA) price is trading in a narrow congestion zone and has shown consolidation over the past sessions. Moreover, the price is trading close to the support region, and buyers are looking for a pullback to initiate a rebound to chase the primary hurdle of $0.3000. Furthermore, the ADA price is close to the upper trendline and is waiting for a breakout above the 20-day EMA spot near $0.2550. Cardano (ADA) price is hovering near neutrality and shows lower investor interest due to underperformance over the past few sessions.

Cardano price is trading below the significant moving averages and tried to exceed the 20-day EMA to initiate a reversal. If the price escapes the immediate hurdle of $0.3000, it will shift the buying momentum to $0.3200. Conversely, if the price breaks the cluster of $0.2550, it will be directed toward $0.2200 soon. However, the chart structure indicates a neutral perspective and does not indicate any bearishness amid the negative market sentiments.

At press time, ADA price is trading at $0.2550 with an intraday gain of 0.57%, showing a neutral chart structure. Moreover, the trading volume increased by 1.89% to $123.72 Million, and the pair of ADA/BTC is at 0.00000942 BTC. The market cap of ADA is $8.98 Billion. Furthermore, analysts maintain a neutral rating and suggest a negative outlook for the following sessions.
ADA Price Action Shows Neutrality on Daily Charts
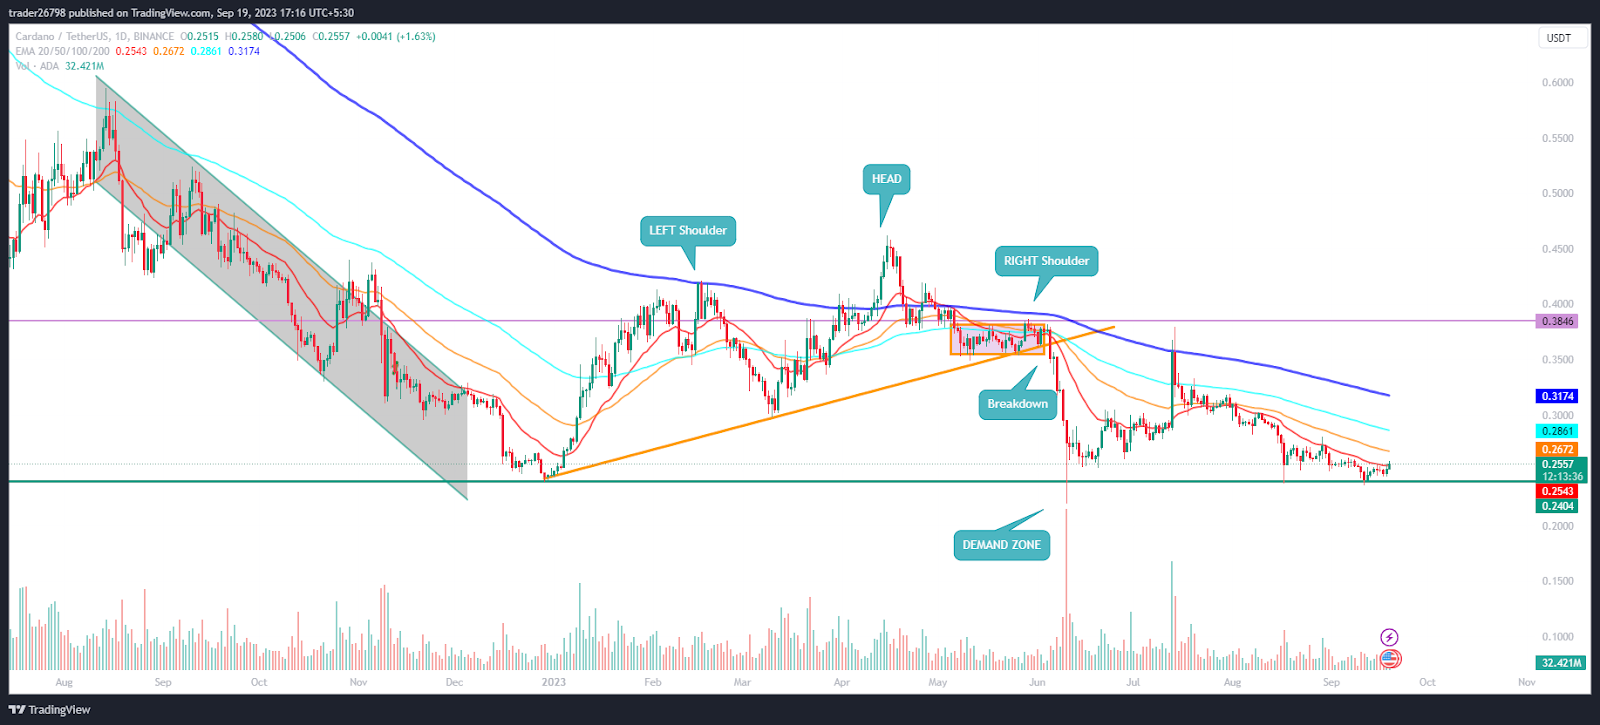
On the daily charts, ADA price witnessed a selloff and showed a breakdown in the past few months, and was unable to retrieve the gains, hovering in the bear trajectory below the 200-day EMA. Furthermore, the price action favors the bears. Average trading volume figures suggest low buyer interest. Moreover, ADA price is now in a consolidation phase and is attempting to break the upper trendline above the 50-day EMA near $0.2700.
Moreover, ADA price is trading close to the 38.2% Fib zone, which is also acting as a support zone suggesting that a significant bounce can be anticipated. ADA will retest the swings of $0.2800 in the following sessions.
What Technical Indicators Say?

On the 4-hour charts, ADA price recovered and started gaining momentum, forming a rising channel. Moreover, the chart shows that bulls want to surpass the 200-day EMA.
The RSI curve stayed in the overbought zone, showing a positive crossover on the charts.
The MACD indicator showed a bullish crossover and formed green bars on the histogram, suggesting a positive outlook for the following sessions.
Summary
Cardano (ADA) price shows a narrow range bound move and is attempting a breakout to surpass the immediate hurdle of $0.2600. Furthermore, the price action suggests buyers want to initiate the reversal. Moreover, the technicals indicate that buyers are starting to make long build-ups and attempting to gain strength, which will lead to a bounce soon.
Technical Levels
Support Levels: $0.2400 and $0.2000
Resistance Levels: $0.2800 and $0.3000
Disclaimer
The views and opinions stated by the author or any other person named in this article are for informational purposes only and do not constitute financial, investment, or other advice. Investing in or trading crypto or stocks comes with a risk of financial loss.

Nancy J. Allen is a crypto enthusiast, with a major in macroeconomics and minor in business statistics. She believes that cryptocurrencies inspire people to be their own banks, and step aside from traditional monetary exchange systems. She is also intrigued by blockchain technology and its functioning. She frequently researches, and posts content on the top altcoins, their theoretical working principles and technical price predictions.


