
 Home
Home News
News
- 1 Kava price 0.50% in the past 24 hours and currently trades at $0.6319.
- 2 Kava price (KAVA) price declined below the exponential moving average of 50 and 200-day EMA.
- 3 The daily chart shows that the KAVA price is declining and forming a bullish flag pattern.
The analysis of Kava Price crypto over the daily chart illustrates that the crypto price has shown signs of recovery and consolidated near the swing low. However, the KAVA price still trades in the bearish territory and is struggling to make a shift in the trend.
The daily chart shows that the price has shown a continuous decline after it failed to break above the key moving average of 200-day EMA. The KAVA crypto has wiped out nearly 40% of its value in the past 3 months.
Also, the technical indicators imply that KAVA trades below the 50-day and 200-day EMA indicating weakness over the daily chart. The RSI and MACD are showing optimistic signs which shows potential buying in the crypto.
KAVA prioritizes security and decentralization. It has a diverse blockchain ecosystem with over 100 app protocol teams and over 100 infrastructure teams. Several independent global foundations fund guarantees to support the development and health of decentralized systems and networks.
Kava Price Trading in Channel Pattern Over the Daily Chart
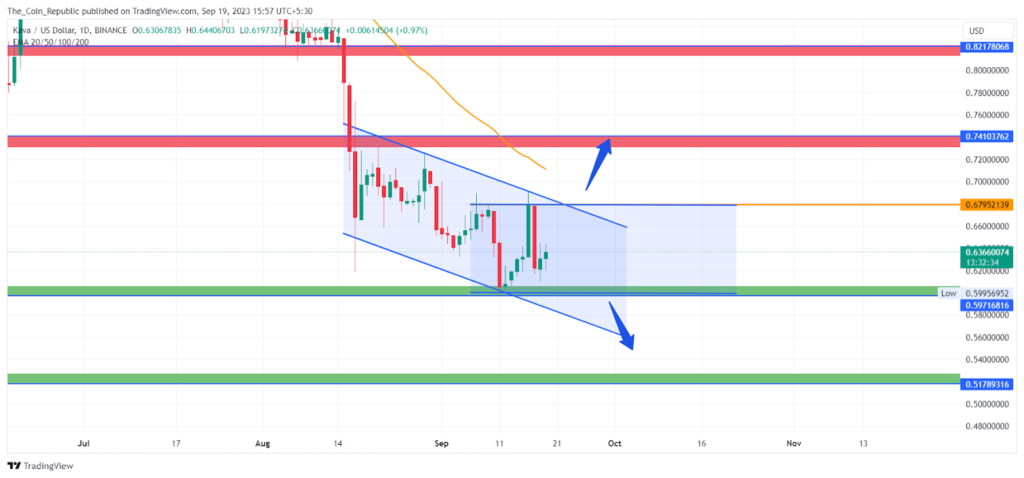
The Kava price currently trades at $0.6319 and is attempting to halt the decline and consolidation at the current level. The breakout or breakdown of consolidation may further decide the next trend of the crypto.
The breakout to the upside may lead to a shift in the trend and the price might hike to the upper supply levels. However, the breakdown of the Kava may resume the ongoing trend.
Technical Indicators Imply Mixed View About The Price Trend

MACD lines are showing a bullish crossover. The histogram bars are also being formed above the mean line of increasing height indicating the possible buying in the crypto.
The EMA analysis shows that the KAVA trades below the 50 and 200-day EMA indicating selling pressure dominance. The buyers must surpass the 50 and 200-day EMA in order to shift the trend.
At the time of publishing, the RSI value of the KAVA token is 43.47 and that of the SMA line is 35.6. RSI shows that the bears are losing momentum and the price might show gains.
Conclusion
Kava crypto price has been in a downtrend for the past 3 months, falling below the 200-day EMA. The price is consolidating near the swing low but is still in the bearish zone. The technical indicators show some signs of optimism, but the trend may not change yet. The Kava price may break out or break down from the consolidation and move to the next levels.
Technical Levels
- Support levels: $0.597 and $0.517.
- Resistance levels: $0.679 and $0.741.
Disclaimer
The views and opinions stated by the author, or any people named in this article, are for informational purposes only and do not establish financial, investment, or other advice. Investing in or trading crypto or stock comes with a risk of financial loss.

With a background in journalism, Ritika Sharma has worked with many reputed media firms focusing on general news such as politics and crime. She joined The Coin Republic as a reporter for crypto, and found a great passion for cryptocurrency, Web3, NFTs and other digital assets. She spends a lot of time researching and delving deeper into these concepts around the clock, and is a strong advocate for women in STEM.


