
 Home
Home News
News
- 1 ATOM crypto price fell by 18.79% since last month.
- 2 Cosmos crypto price at press time was $6.913, with a drop of 0.53%% in the last 24 hours; market cap was $2.515 Billion.
ATOM price is falling. Having dropped more than 18.79% in a month and 24.59% in 3 months. However, Cosmos has given negative returns since the beginning of the year (-25.97%), while in the 6-month period, it gave 37.66% returns.
Nevertheless, the price might conquer supporting SMAs by making lower highs and lows if there is a spike in buying volume. Hence, the ATOMUSD price is expected to move downwards giving bearish views over the daily time frame chart.

Cosmos’ price could rise further and reach the targets of $9.800 and $10.800 if it stays at this level. But if it drops below this level, it could face the support levels of $8.300 and $7.700. ATOMUSD price was $6.913 at the time of writing, with a 24-hour trading volume of 108.603K. The average volume for the last 10 days was 175.079K. The market cap of the crypto was $2.515 Billion.
The weekly technical charts show a weak bearish trend for Cosmos. The daily chart also shows a strong downward trend for the asset price. ATOM price is in between the 50, 100, and 200-day EMAs. A strong bullish trend could emerge if the price breaks above the 200-day EMA.
Traders and investors should wait for a clear signal of a break above or below the range before making any moves and avoid FOMO to reduce losses.
Technical Analysis of ATOM Crypto Price in 1-D Timeframe
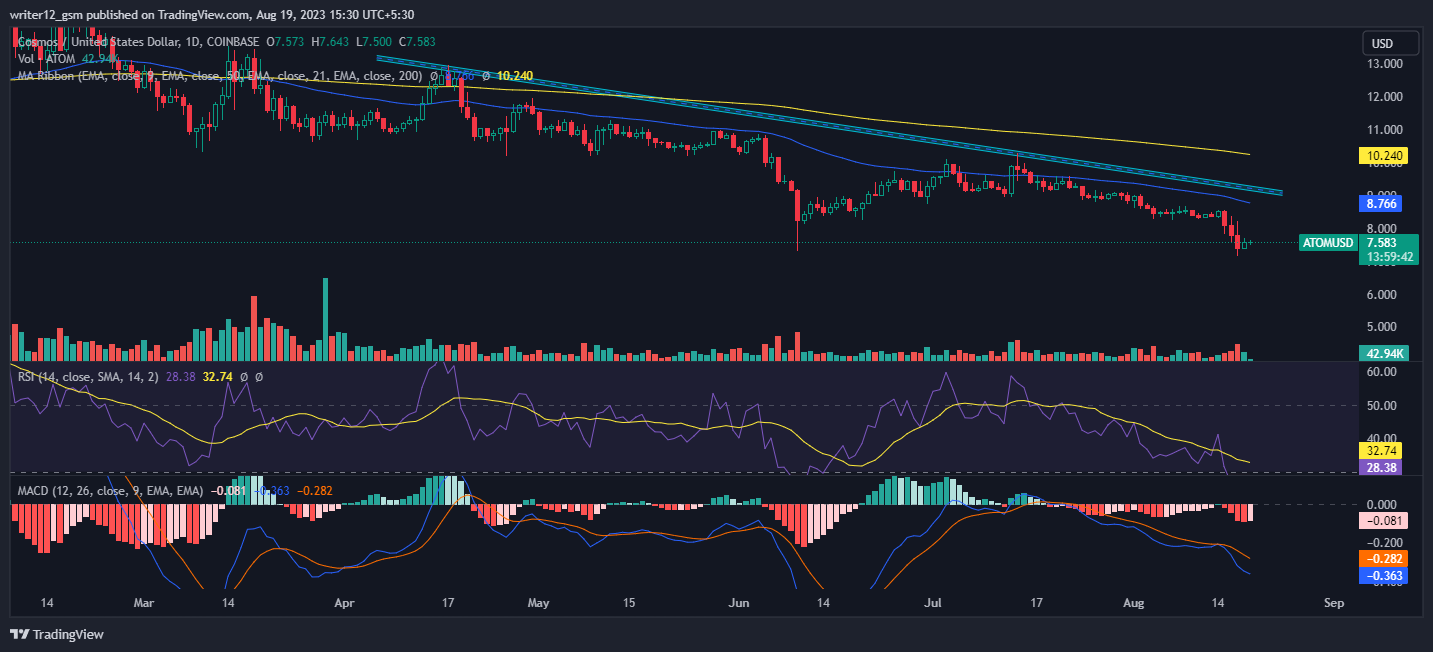
At the time of publishing, ATOM crypto is trading below the 50 and 200-day exponential moving averages, which are supporting the price trend.
The current value of the RSI is 37 points. The 14 SMA is above the median line at 32 points which indicates that the ATOM crypto is bearish.
The MACD line at -0.335 and the signal line at -0.375 are below the zero line. A bearish crossover is observed in the MACD which signals more bearishness.
Summary
The ATOMUSD crypto price is in a strong downtrend – it is unable to break above the previous resistance levels and the moving averages. The price action shows that the sellers have the upper hand. The technical indicators also support the bearish view – MACD, RSI, and EMA are all negative. The 1-D time frame indicates that the investors and traders are pessimistic about the ATOM price. The price action may continue to decline in the near future.
Technical Levels
- Resistance Levels: $9.800 and $10.800.
- Support Levels: $8.300 and $7.700.
Disclaimer
This article is for informational purposes only and does not provide any financial, investment, or other advice. The author or any people mentioned in this article are not responsible for any financial loss that may occur from investing in or trading crypto. Please do your own research before making any financial decisions.
Steve Anderson is an Australian crypto enthusiast. He is a specialist in management and trading for over 5 years. Steve has worked as a crypto trader, he loves learning about decentralisation, understanding the true potential of the blockchain.


