
 Home
Home News
News
- 1 XRP price is in a range and faces multiple barriers to extend the buying momentum.
- 2 Buyers want to exceed the 200-day EMA hurdle to increase the gains.
XRP price is trading in a narrow range and has been in a congestion range below the 200-day EMA over the past few sessions. However, the buyers persisted in attempting a pullback, extending the buying momentum to retain the spot of $1. Recently, the XRP price retested the demand zone and formed a rejection candlestick, indicating that buyers have a strong grip. However, bulls need massive strength and extreme momentum to break the cage, to escape the primary hurdle above the neckline of $0.6000.

XRP price is in a cage and it could have escaped the 200-day EMA barrier over the past few days. The price action shows seller dominance and suggests bullish activity persists. XRP price is trading below neutrality, exceeding the 20-day EMA, which shows buyers are trying to pull back and will likely exceed the follow-on buying momentum to escape the 200-day EMA.

At press time, XRP price is trading at $0.5090 with an intraday gain of 1.17%, showing neutrality on the charts. Moreover, the trading volume increased by 3.82% to $1.07 Billion, and the pair of XRP/BTC is at 0.0000188 BTC. Moreover, the market cap of XRP is $27.15 Billion. However, analysts maintained a neutral rating and suggested a negative outlook for the following sessions.
XRP Price Action on Daily Charts
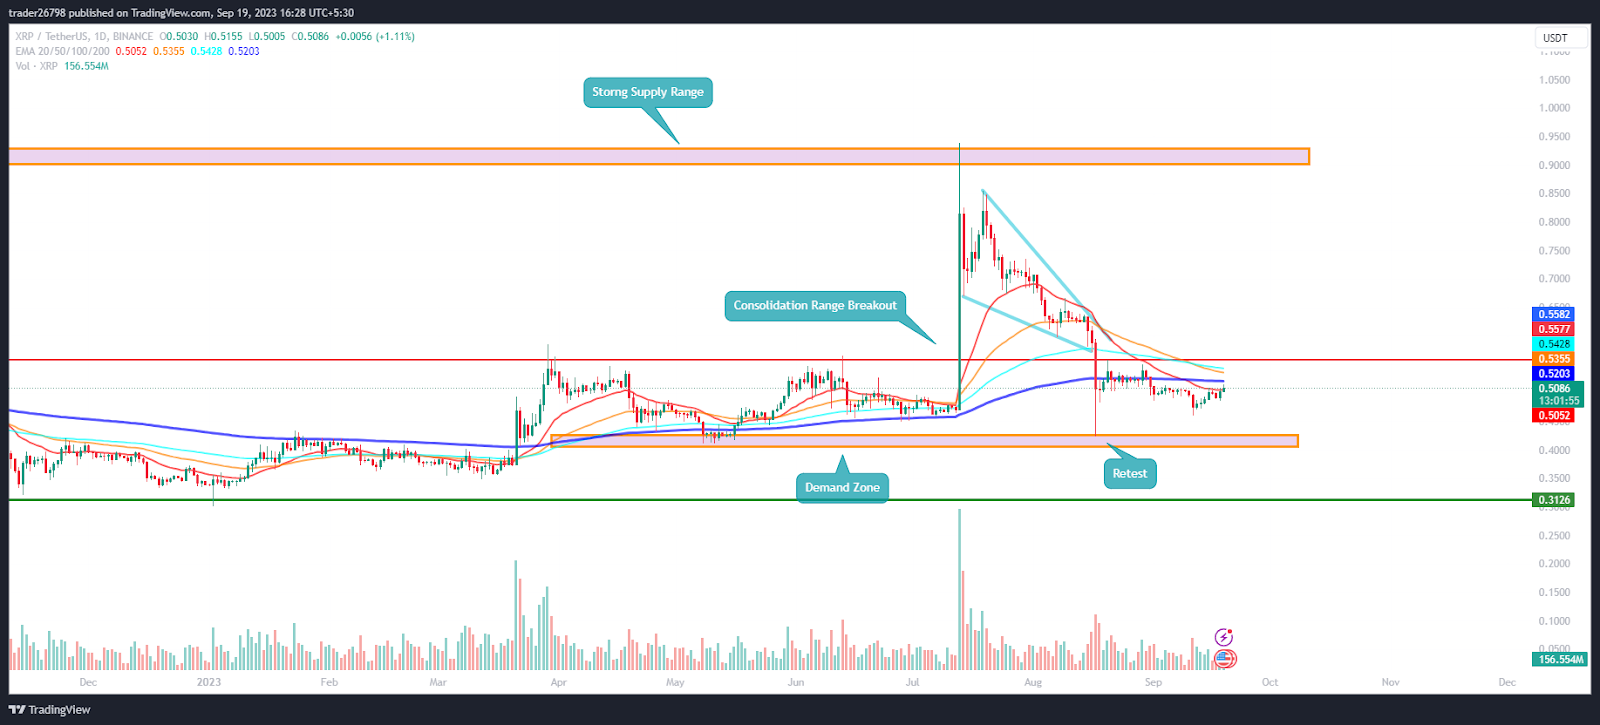
On the daily charts, XRP price is trading near the 200-day EMA awaiting follow-on buying momentum to extend the reversal toward $0.6000. Furthermore, the price action showed that the XRP price had faced the supply zone near $0.9000 and faced a substantial setback, resulting in retracement toward the origin and demand zone near $0.5000. However, the bulls held the gains and absorbed the selling pressure. Afterward, XRP price remained in a narrow congestion range and hovered below the neutrality.
Short Term Charts Shows Ascending Triangle Pattern
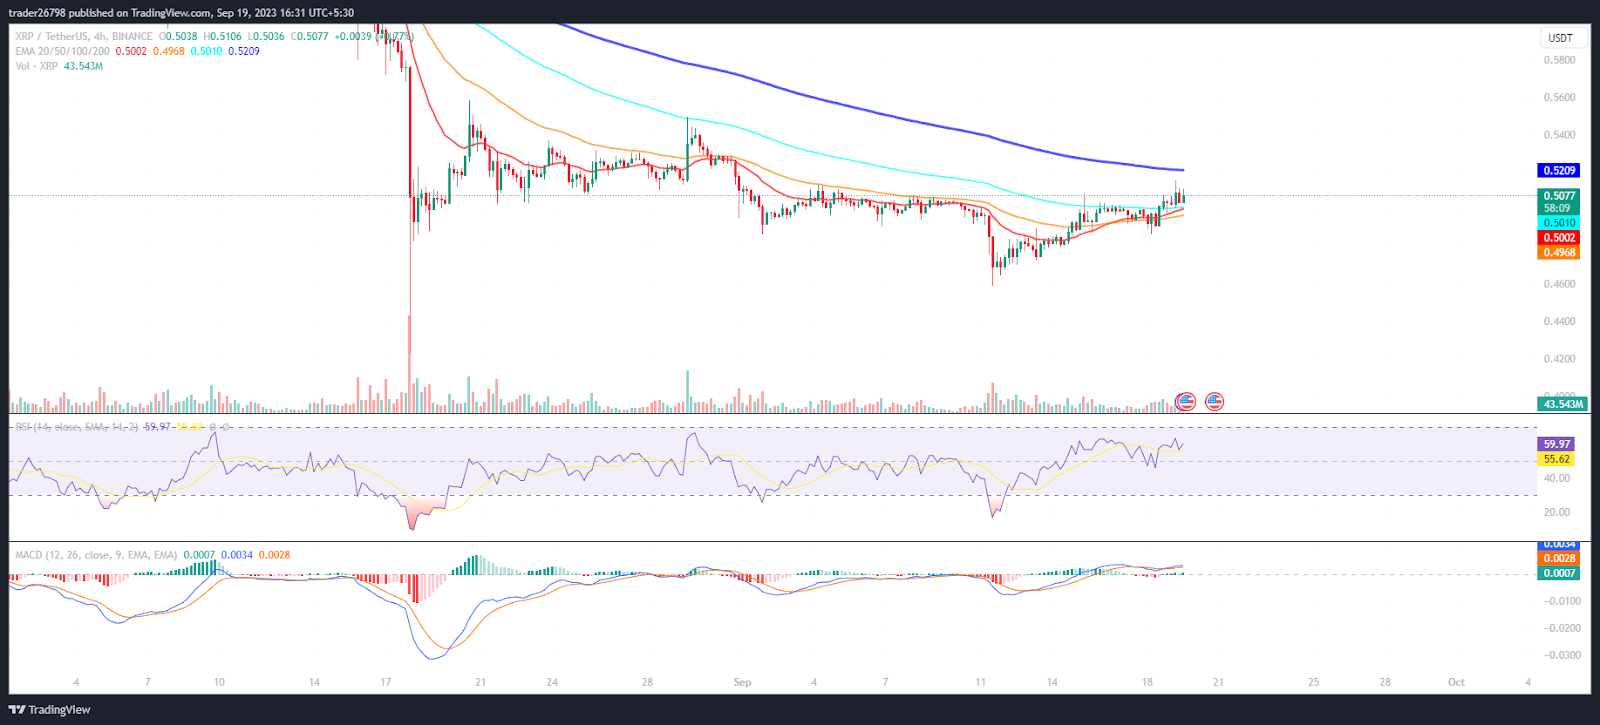
On the 4-hour charts, the XRP price shows an ascending triangle pattern, reviving the past sessions’ gains. Furthermore, the buyers are looking to retest the 200-day EMA soon, which, if surpassed, will extend the buying momentum and favor bulls.
The RSI curve stayed in the overbought zone, showing a positive crossover which highlights the bulls’ efforts to increase the momentum.
The MACD indicator showed a bullish crossover and formed green bars on the histogram, indicating that bulls are attempting to retain the highs near $0.6000.
Summary
XRP price action indicates neutrality and could retest the 200-day EMA, showing the buyers’ efforts in the past sessions. Furthermore, the bulls want to retain the gains, proceed with the reversal, and surpass the 20-day EMA barrier, showing that buying interest indicates a long build-up activity in the last few sessions.
Technical Levels
Support Levels: $0.5000 and $0.4000
Resistance Levels: $0.6000 and $0.8000
Disclaimer
The views and opinions stated by the author or any other person named in this article are for informational purposes only and do not constitute financial, investment, or other advice. Investing in or trading crypto or stocks comes with a risk of financial loss.

With a background in journalism, Ritika Sharma has worked with many reputed media firms focusing on general news such as politics and crime. She joined The Coin Republic as a reporter for crypto, and found a great passion for cryptocurrency, Web3, NFTs and other digital assets. She spends a lot of time researching and delving deeper into these concepts around the clock, and is a strong advocate for women in STEM.


