
 Home
Home News
News
- 1 Zcash crypto price increased by 4.80% over the past seven days.
- 2 Zcash crypto price is currently trading at $26.02 with a rise of 0.81% in the last 24 hours with a current market cap of $424.208 Million.
Zcash crypto continues to exhibit weakness on the charts, with sellers exerting significant pressure in recent trading sessions. Furthermore, the chart structure favors the bears, and the price continues to take rejection from 50 EMA, which shows a fight between bears and bulls.

At the time of writing, the Zcash crypto trades at $26.02 with an intraday gain of 0.81%. Buyers are making efforts to gain traction in the market, but they were only able to secure a few critical support levels. Intraday trading volume is 8.407K. Moreover, the ZEC crypto suggests further volatility in the following sessions.

The Zcash crypto is trading in a downtrend on the daily charts and underperformed in the past few months. Furthermore, the technical indicators continue to signal bearishness, with no signs of a bullish reversal or bounce as of now.
Technical Analysis of Zcash Crypto Price in 1-D Timeframe
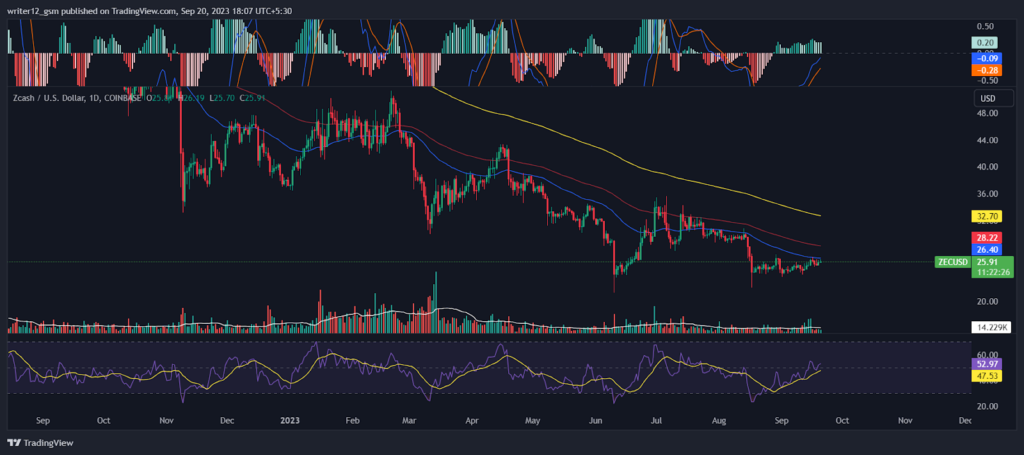
At the time of publishing, Zcash crypto (USD: ZEC) is trading above the 50 and 200-day SMAs (simple moving averages), which supports the price trend.
However, if selling volume adds up, then the price might conquer supporting SMAs by making lower highs and lows. Hence, the ZEC price is expected to move downwards giving bearish views over the daily time frame chart.
The current value of RSI is 52.78 points. The 14 SMA is below the median line at 47.51 points which indicates that the Zcash crypto is bearish.
The MACD line at -0.09 and the signal line at -0.28 are above the zero line. A bullish crossover is observed in the MACD indicator which signals more strength for the ZEC crypto price.
On the 4-hour charts, the Zcash price is currently under the control of the sellers, and buyers are not able to surpass the range of neutrality. The price action indicates that sellers are persistently pushing back against the bulls below the lower trajectory, causing the gains from the top to erode.
The relative strength index (RSI) curve is near the neutral range of 52, indicating neutrality. The MACD is also indicating neutrality which suggests that a significant move could be seen in the upcoming sessions.
Summary
Zcash (USD: ZEC) technical oscillators also support the bearish trend. The MACD, RSI, and EMA are emphasizing negative signs and imply that the downtrend may continue in the ZEC crypto price. Zcash Price action suggests that the investors and traders are bearish on the 1-D time frame. The price action reflects a bearish perspective at the moment.
Technical Levels
- Support Levels: $20.90 and $17.04.
- Resistance Levels: $29.72 and $34.68.
Disclaimer
This article is for informational purposes only and does not provide any financial, investment, or other advice. The author or any people mentioned in this article are not responsible for any financial loss that may occur from investing in or trading. Please do your own research before making any financial decisions

Adarsh Singh is a true connoisseur of Defi and Blockchain technologies, who left his job at a “Big 4” multinational finance firm to pursue crypto and NFT trading full-time. He has a strong background in finance, with MBA from a prestigious B-school. He delves deep into these innovative fields, unraveling their intricacies. Uncovering hidden gems, be it coins, tokens or NFTs, is his expertise. NFTs drive deep interest for him, and his creative analysis of NFTs opens up engaging narratives. He strives to bring decentralized digital assets accessible to the masses.


