
 Home
Home News
News

- 1 ZM stock price is taking rejection from the 200 EMA curve.
- 2 Zoom stock shows selling pressure; and is heading toward the demand zone of $65.
ZM stock price is taking rejection from 200 EMA and breaking below the 50 and 100 EMA curves indicating bearishness on the daily chart frame. This shows that the bears are in control and the stock has lost its momentum. The stock has also broken below the key moving averages, which indicates further weakness.
The stock has created a bearish outlook and erased the gains it made in the previous month. Zoom (NASDAQ: ZM) stock has returned below the key moving averages. The technical analysis suggests that the stock is oversold and could bounce back from the lower levels. However, the stock needs to show some signs of strength and reversal before confirming a pullback rally.

Zoom stock price is in a correction phase but trading near the crucial support of $68. If formed, a bearish candle indicates sellers are active and will try their best to pull down the price. ZM stock price closed the previous session at $69.34 with an intraday loss of 1.83%. If the buyers succeed in defending the current support levels, then the possibility of a bounce back will increase. However, if the sell-off continues and Zoom stock drops below $65 then more downfall is possible.
Buyers tried multiple times to break the higher range and expand upwards. However, due to the strong presence of sellers, prices faced rejection. It shows sellers are still active on higher levels.
Technical Analysis of Zoom Stock Price in 1-D Timeframe
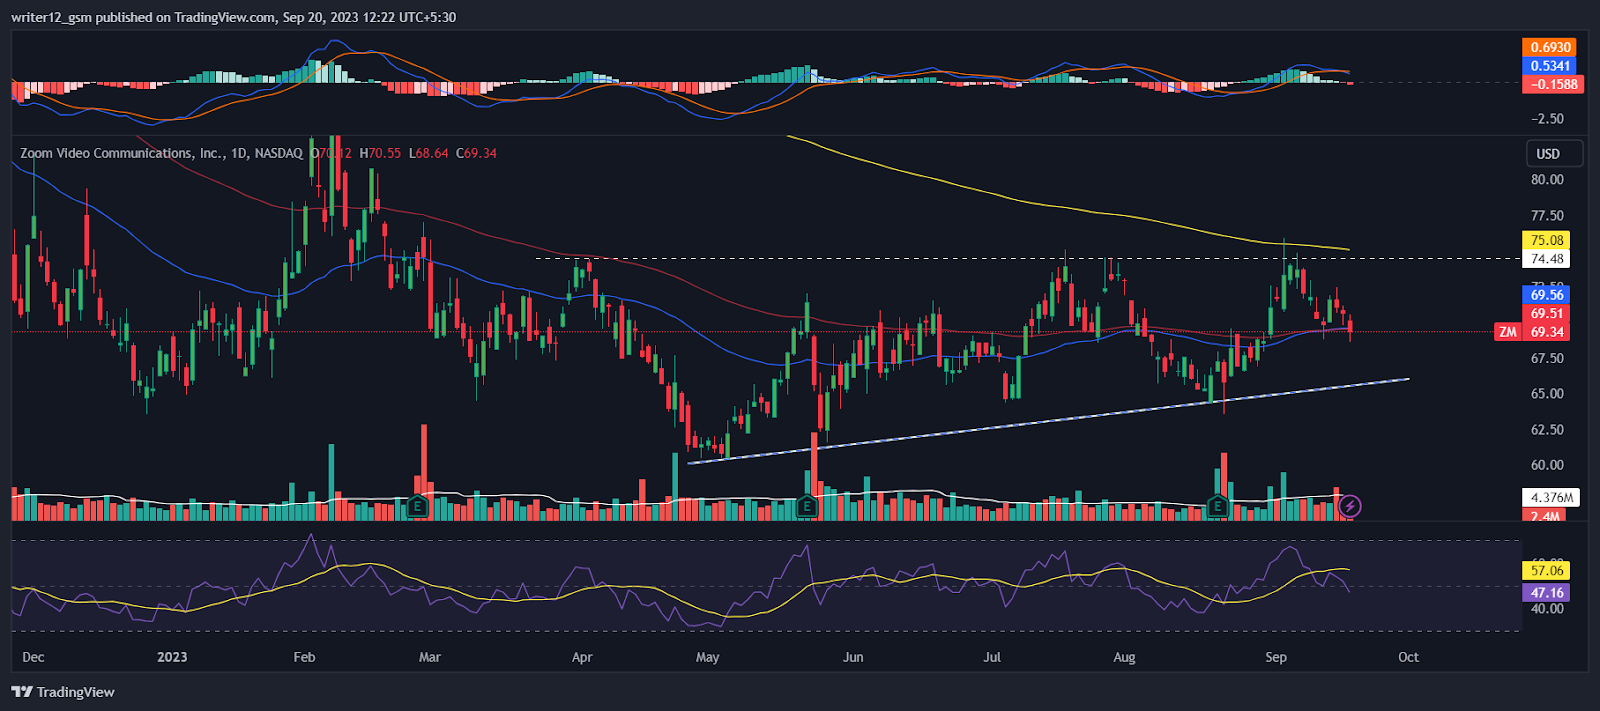
Zoom price is trading below the downward-sloping 50-day and 200-day EMAs showcasing a downtrend. However, Zoom price has not gone far away from the EMAs.
The current value of RSI is 47.16 points. The 14 SMA is above the median line at 57.06 points which indicates that the Zoom stock price is bearish. The MACD generated a negative crossover and the histogram is also red, indicating bearishness.
4-Hour Time Horizon Analysis
Zoom stock has shown sellers’ strength on the 4-H charts. Moreover, the price is below the key EMAs, which shows further weakness in the stock. The RSI curve is near the oversold region at 42. The MACD also persisted to form red bars, and a bearish crossover was noted, which signals corrective moves.
Summary
Zoom stock technical oscillators also support the bearish trend. The MACD, RSI, and EMA are emphasizing negative signs and imply that the downtrend may continue in the ZM stock price. Zoom Price action suggests that the investors and traders are bearish on the 1-D time frame. The price action reflects a bearish perspective at the moment.
Technical Levels
- Support Levels: $65.40 and $59.76.
- Resistance Levels: $74.85 and $78.67.
Disclaimer
This article is for informational purposes only and does not provide any financial, investment, or other advice. The author or any people mentioned in this article are not responsible for any financial loss that may occur from investing in or trading. Please do your own research before making any financial decisions.

Adarsh Singh is a true connoisseur of Defi and Blockchain technologies, who left his job at a “Big 4” multinational finance firm to pursue crypto and NFT trading full-time. He has a strong background in finance, with MBA from a prestigious B-school. He delves deep into these innovative fields, unraveling their intricacies. Uncovering hidden gems, be it coins, tokens or NFTs, is his expertise. NFTs drive deep interest for him, and his creative analysis of NFTs opens up engaging narratives. He strives to bring decentralized digital assets accessible to the masses.


