
 Home
Home News
News

- 1 Trex stock price is currently trading at $63.21 with a drop of 2.09% in the last 24 hours and a market cap of $6.862 Billion.
- 2 TREX stock price decreased by 4.66% over the past seven days.
Trex stock price is facing strong bearish pressure on the daily technical charts, as it is trading below the 100 and 50-day EMAs. The stock failed to sustain above its key resistance levels near the EMAs in the past few days.

The stock is currently trading near $63.21, with a marginal loss of 2.09% in the intraday session. The stock has an upside target of $70, but it needs to overcome the bearish momentum and surge above the 100-day EMA. The stock has a support level of $61, which could prevent further downside.

Trex stock price prediction suggests that the stock is in the firm grip of the bears and needs to show signs of a reversal before a bullish trend can be confirmed.
The technical indicators favor the bears, projecting a pessimistic perspective for the buyers. RSI and stochastic RSI oscillator are moving near the overbought zone whereas the major EMA lines are acting as barriers for TREX price.
The company’s performance has been decent so far into the year despite weakness in the past few sessions. It has given positive returns of 45.95% in the year-to-date period, 37.98% in the last six months, -7.71% in the last month, and -4.66% last week.
Technical Analysis of Trex Stock Price in 1-D Timeframe
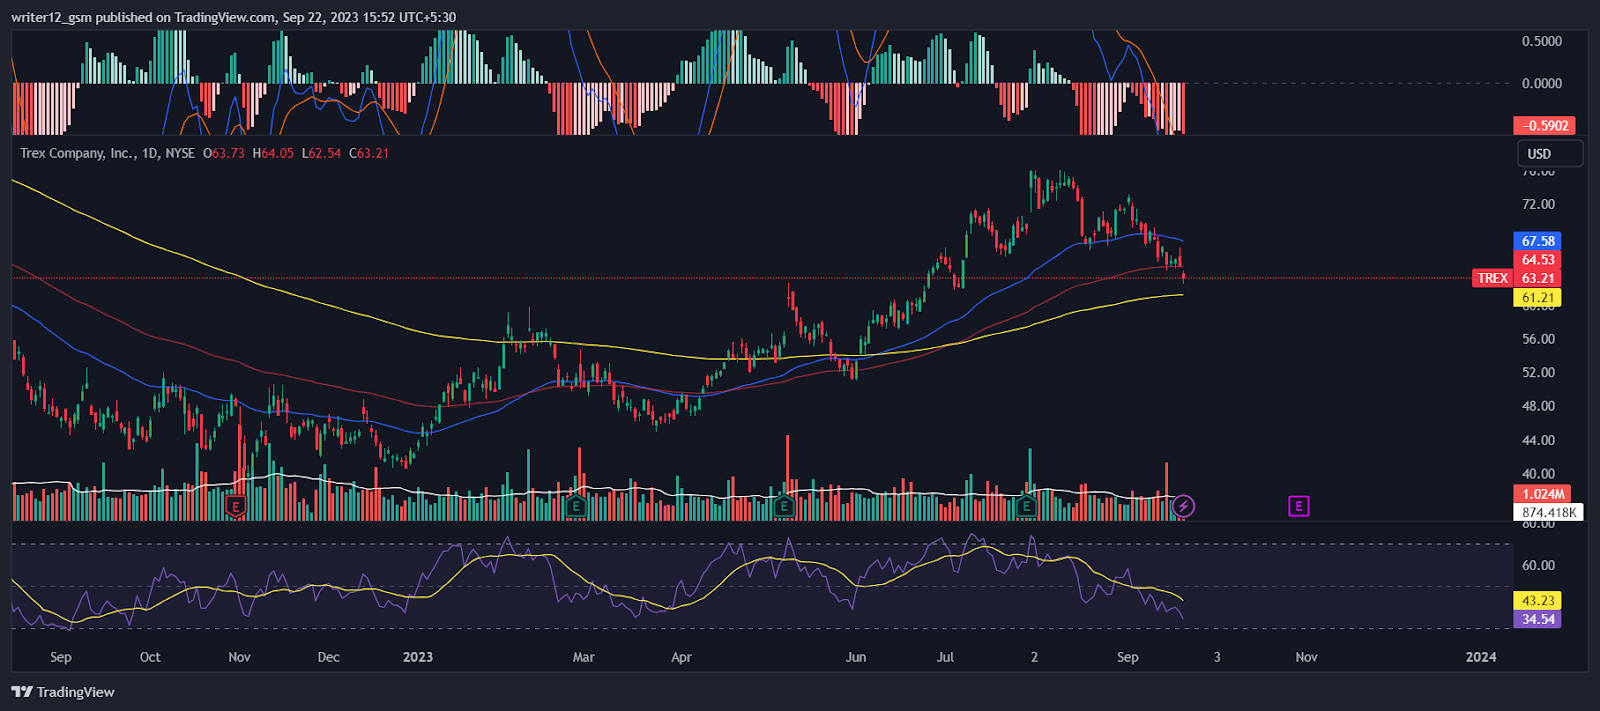
Trex stock (NYSE: TREX) is trading under the 50 and 100-day DMAs (daily moving averages), which do not uphold the price trend.
The current value of RSI is 34.54 points. The 14 SMA is above the median line at 43.23 points which indicates that the Trex stock is bearish.
The MACD line at -1.51 and the signal line at -0.9235 are below the zero line. A bearish crossover is observed in the MACD which signals more bearishness for the TREX stock price.
Weekly-Time Horizon Analysis
The weekly charts of Trex stock reveal that the sellers have been dominant. The stock is in a downturn, breaking the 100 EMA. The technical indicators also confirm the bearish sentiment, as the RSI is near the oversold zone at 50, heading downward. The MACD has shows red bars and a bearish crossover. These signals indicate that the stock may face more downward pressure in the coming weeks.
Summary
Trex (NYSE: TREX) technical oscillators are bearish. The MACD, RSI, and EMAs are emphasizing negative signs and imply that the downtrend may continue in the TREX stock price. Trex price action suggests that the investors and traders are bearish on the 1-D time frame. The price action reflects a bearish perspective at the moment.
Technical Levels
- Support Levels: The Trex stock price may find support at $60.00 and $52.30, where it could bounce back or stabilize.
- Resistance levels: The TREX stock price may face resistance at $66.59 and $71.32, where it could reverse or consolidate.
Disclaimer
This article is for informational purposes only and does not provide any financial, investment, or other advice. The author or any people mentioned in this article are not responsible for any financial loss that may occur from investing in or trading. Please do your own research before making any financial decisions.

With a background in journalism, Ritika Sharma has worked with many reputed media firms focusing on general news such as politics and crime. She joined The Coin Republic as a reporter for crypto, and found a great passion for cryptocurrency, Web3, NFTs and other digital assets. She spends a lot of time researching and delving deeper into these concepts around the clock, and is a strong advocate for women in STEM.


