
 Home
Home News
News
- 1 META stock price decreased by 4.02% over the past week.
- 2 Meta Platforms Inc. (NASDAQ: META) stock’s 52-week price range is $88 – $326.
The CEO of Meta Platforms, Mark Zuckerberg, is going to unveil the Meta Quest 3 headset in an upcoming event. It will have improvised features such as eye-tracking recognition along with facial expressions.
This event will showcase the company’s recent Artificial Intelligence (AI) and immersive tech products for its metaverse. The Meta Quest 3 headset is a Virtual Reality (VR) device. The Meta stock has a float of 2.215 Billion shares and a market cap of $769.581 Billion. The Meta stock’s average volume for the last 10 days is 18.908 Million and its current volume is 12.37 Million.
The Meta stock’s earnings per share (EPS) for the trailing twelve months is 8.64 and its price-to-earnings ratio for the same period is 34.47. The Meta stock has a CMP of $299.08 and an intraday gain of 1.13%. The latest quarterly report for the period ending June 2023 showed a revenue of $32.00 Billion, a net income of $7.79 Billion, and a profit margin of 24.34%.
The latest quarterly balance sheet of Meta for the quarter ending June 2023 reported $206.69 Billion in total assets and $72.66 Billion in total liabilities.
Technical Analysis of META Stock Price in 1-D Timeframe
The price action shows that Meta Platforms Inc. (NASDAQ: META) stock price has been on an inclining trend since last year, increasing 111.29% in performance by making higher highs and higher lows.
At the time of writing, META stock is facing resistance from the last earnings report and managing to decline with the downward trendline.
Therefore, if the META price fails to sustain the current level and drops, it might hit the nearest support levels of $292 and $277. However, if it maintains the current level, the META price could continue to move upward and reach the first and second resistances of $310 and $326.
At the time of publishing, Meta Platforms Inc. (NASDAQ: META) is trading below 20-day EMA (exponential moving averages), which rejects the Meta price trend, and if more selling volume adds up then the Meta price might conquer supporting EMAs, and support levels by making lower highs and lows.
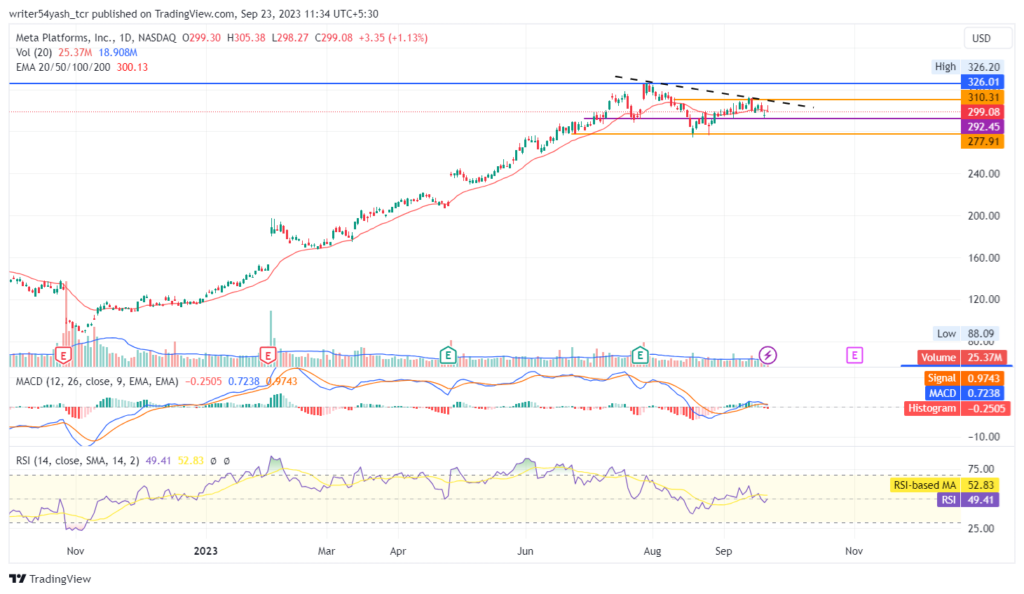
The current value of RSI is 49.41 points. The 14 SMA is above the median line at 52.83 points which indicates that the Meta stock took rejection from the 14 SMA line, indicating the bearishness.
The MACD line at 0.7238 and signal line at 0.9743 are above the zero line and both lines have crossed each other. A bearish crossover is observed in the MACD oscillator which might signal more bearishness for the Meta stock price.
Summary
The investors and traders of the Meta Platforms Inc. (NASDAQ: META) stock are bearish on the daily time frame. The price action reflects a bearish outlook at the time of publishing as the price is facing trendline resistance. The technical analysis oscillators and moving averages of the Meta stock price highlight negative signals and imply that the downtrend may continue in the stock price.
Technical Levels
- Support levels: $292 and $277
- Resistance levels: $310 and $326
Disclaimer
In this article, the views and opinions stated by the author, or any people named are for informational purposes only, and they don’t establish the investment, financial, or any other advice. Trading or investing in cryptocurrency assets comes with a risk of financial loss.

Nancy J. Allen is a crypto enthusiast, with a major in macroeconomics and minor in business statistics. She believes that cryptocurrencies inspire people to be their own banks, and step aside from traditional monetary exchange systems. She is also intrigued by blockchain technology and its functioning. She frequently researches, and posts content on the top altcoins, their theoretical working principles and technical price predictions.


