
 Home
Home News
News
- 1 Zcash price (ZEC) surged 1.71% in the past 24 hours and is currently trading at $26.70.
- 2 The daily chart shows that Zcash price struggles to break above the 50-day exponential moving average.
- 3 ZEC price consolidates near the upper boundary of the bearish channel pattern.
Zcash price analysis illustrates the consolidation of the price over the daily chart. The intensity of the consolidation has been over 37 days and is in the 10% range. The ZEC crypto price currently trades at the top of the consolidation near a 50-day EMA indicating early signs of breakout.

The ZEC daily chart shows that the price trend favored the bears and has been in a long-term declining trend. The daily chart witnesses the formation of a descending channel pattern. The ZEC price kept rolling within the boundaries of the pattern and declined.

The technical indicators suggest that the Zcash price fell below the 50-day and 200-day EMAs indicating weakness on the ZEC price chart. The EMAs acted as a dynamic resistance to the price pushed back the price down after every attempt to surge.
Zcash originated in 2008 as a decentralized cryptocurrency and holds a market cap of $517.3 Billion at press time. Zcash accounts for a 49.2% share of the overall crypto market in terms of market cap. It has delivered a 61% year-to-date return to the investors.
ZEC is a cryptocurrency that was based on Bitcoin’s code. It has two types of transactions: transparent and shielded. Transparent transactions are like Bitcoin’s: they use public addresses and are recorded on a public ledger (the blockchain).
Zcash Price Suffered Rejection From 50-Day EMA
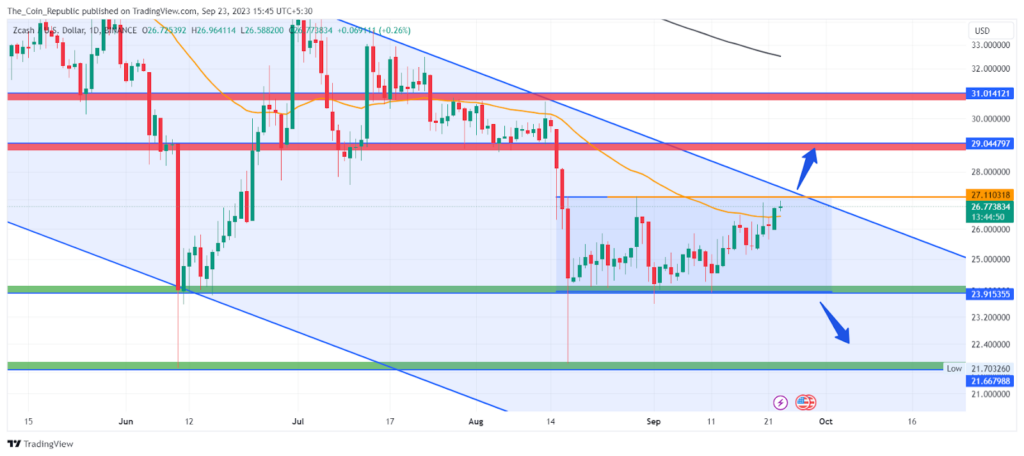
The Zcash price is currently trades at $26.70 with an intraday gain of 1.71%. The ZEC price currently trades in a 10% consolidation zone and near the upper boundary of the declining channel pattern. The breakout of the channel pattern may shift the short-term trend in the bulls’ favor and the price may surge above the $30 level.
Moreover, the breakdown of the price below $23.9 may align the short-term trend towards the current long-term trend and the price may decline sharply.
Technical Indicators Show Optimistic Signals for ZEC
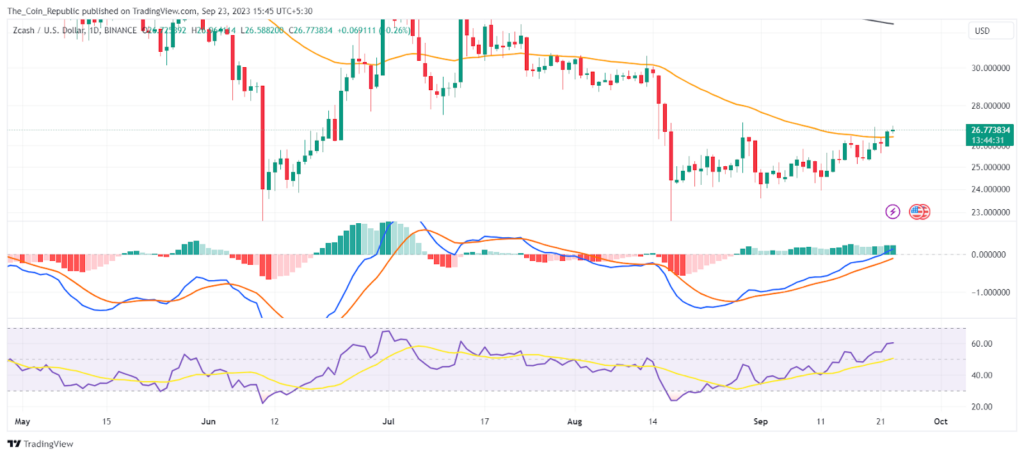
MACD lines are showing a positive crossover. The histogram bars are also being formed above the mean line of increasing height, indicating the buyers are regaining momentum.
The EMA analysis shows that the ZEC price sustains near the 50-day EMA indicating the dominance of buyers in the short term.
Conclusion
Zcash is a cryptocurrency that offers two types of transactions: transparent and shielded. The Zcash price has been in a downtrend and trading in a narrow range for over a month. The price is near the 50-day EMA and on top of the descending channel pattern. A breakout above the channel may lead to a bullish reversal and a surge above $30. A breakdown below $23.9 may trigger a sharp decline and align with the long-term trend.
Technical Levels
- Support Levels: $23.9 and $21.6
- Resistance Levels: $26.7 and $29.04
Disclaimer
The views and opinions stated by the author, or any people named in this article, are for informational purposes only and do not establish financial, investment, or other advice. Investing in or trading crypto or stock comes with a risk of financial loss.

Adarsh Singh is a true connoisseur of Defi and Blockchain technologies, who left his job at a “Big 4” multinational finance firm to pursue crypto and NFT trading full-time. He has a strong background in finance, with MBA from a prestigious B-school. He delves deep into these innovative fields, unraveling their intricacies. Uncovering hidden gems, be it coins, tokens or NFTs, is his expertise. NFTs drive deep interest for him, and his creative analysis of NFTs opens up engaging narratives. He strives to bring decentralized digital assets accessible to the masses.


