
 Home
Home News
News
- 1 Carrier stock price is currently trading at $52.87 with a drop of 0.59% in the last 24 hours with a current market cap of $44.285 Million.
- 2 Carrier stock price decreased by 2.69% over the past seven days.
Carrier stock failed to sustain the high of $60 and reversed its direction, forming a double-top pattern, resuming the downtrend that indicates further weakness in the market. The market is trading below the dynamic support trendline, which could lead to more downside. The market is also in a downtrend on a larger timeframe, as it is creating lower lows.
Carrier has been falling from its peak levels and forming lower-low structures. It is in a bearish trend after breaking below the 20-day and 50-day moving averages. The bearish pressure could soon push CARR stock to form a new lower low and extend the downtrend.

The current situation requires traders and investors to be patient and wait for a clear signal of a break above or below the range before making any moves. They should also avoid FOMO and minimize losses.
Carrier stock price fell 2.69% last week. Iit declined by 3.94% through the month. Furthermore, CARR shares experienced a gain of roughly 18.30% over the past six months and a decrease of 47.07% over the past year.
Additionally, the CARR share price has gained approximately 26.06% year to date. These trends collectively indicate weakness in the stock price.
Technical Analysis of Carrier Stock Price in 1-D Timeframe
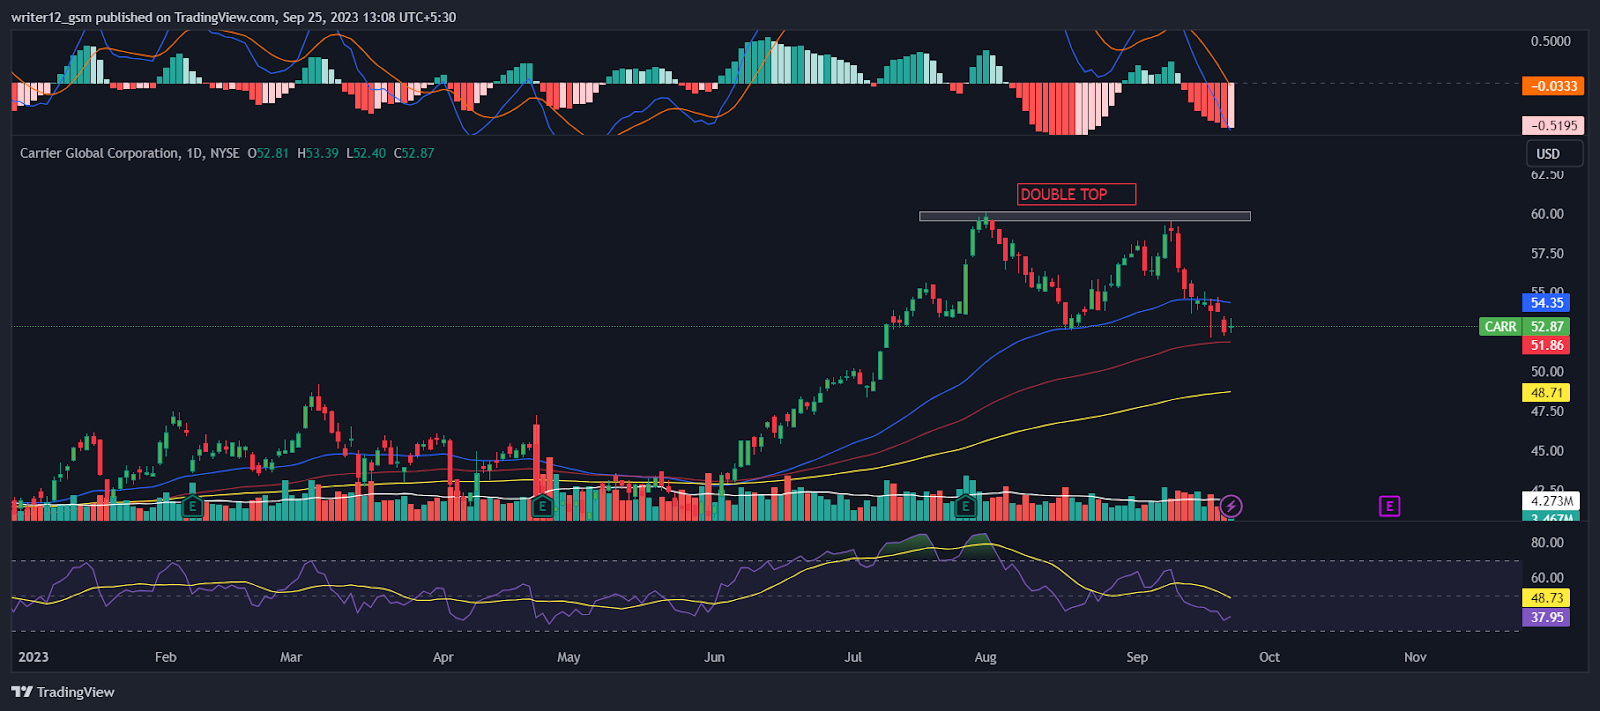
At the moment, Carrier stock (NYSE: CARR) is trading below the 20 and 50-day EMAs (exponential moving averages), which do not support the price trend. If bulls want to make a comeback, they will have to rise and sustain the price above the 100-day EMA. However, the sellers seem to be more aggressive than the buyers.
The current value of RSI is 37.95 points. The 14 SMA is above the median line at 48.73 points which indicates that the Carrier stock is bearish.
The MACD line at -0.5528 and the signal line at -0.0333 are below the zero line. A bearish crossover is observed in the MACD which signals more bearishness for the CARR stock price.
Summary
Carrier stock price prediction suggests mild bearishness in the chart. The sellers are dominating on the higher levels. Carrier (NYSE: CARR) technical oscillators also support the bearish trend. The MACD, RSI, and EMAs are emphasizing negative signs and imply that the downtrend may continue in the CARR stock price. Carrier price action suggests that the investors and traders are bearish on the 1-D time frame. The technical analysis suggests that the Carrier stock price is in a bearish grip and the probability of testing the previous highs in the coming months is low.
Technical Levels
- Support Levels: $51.86 and $48.71.
- Resistance Levels: $54.35 and $58.00.
Disclaimer
This article is for informational purposes only and does not provide any financial, investment, or other advice. The author or any people mentioned in this article are not responsible for any financial loss that may occur from investing in or trading. Please do your own research before making any financial decisions
Mr. Pratik chadhokar is an Indian Forex, Cryptocurrencies and Financial Market Advisor and analyst with a background in IT and Financial market Strategist. He specialises in market strategies and technical analysis and has spent over a year as a financial markets contributor and observer. He possesses strong technical analytical skills and is well known for his entertaining and informative analysis of the Financial markets.


