
 Home
Home News
News
- 1 The UNUS SED LEO coin’s price is up by 1.76% over the last week and is below the 20, and 50 EMAs.
- 2 The price of the LEO coin is at $3.78320000 and the 52-week range is $3.31500000 – $6.500000000.
LEO Token crypto surged by 1.31% in market value and surged by 50.75% in trading volume in the last 24 hours, as per the coinmarketcap, a crypto data analysis website. Its market value is $3,502,331,523 and its trading volume is $827,549. There are 929,225,746 LEO in circulation.
The maximum market cap of UNUS SED LEO (LEO) is $3,714,072,215, assuming all 990 Million LEO Tokens are in circulation today. This is the fully diluted valuation (FDV) of the token. According to Coingecko, a website that provides crypto data and information, the actual number of tokens in circulation may be lower, depending on how the LEO Tokens are distributed over time. Therefore, it may take several years for the FDV to be achieved.
LEO Coin Price Technical Analysis in the 1-Day Timeframe
The LEO price faced resistance from the exponential moving averages (EMAs) and was $3.78320000 with an intraday gain of 1.76%.
LEO price had been falling for a long time following a downward trendline on the chart and facing constant resistance. At the time of writing, LEO price was $3.78320000, moving sideways in a range. Furthermore, if LEO breaks above the nearest resistance, it might rise to reclaim levels. A bullish perspective would suggest LEO price could meet the nearest resistance levels at $4 and $5.
On the other hand, LEO price could resume its downtrend and reach the nearest support levels at $3 and $2 if it fails to hold the current level.
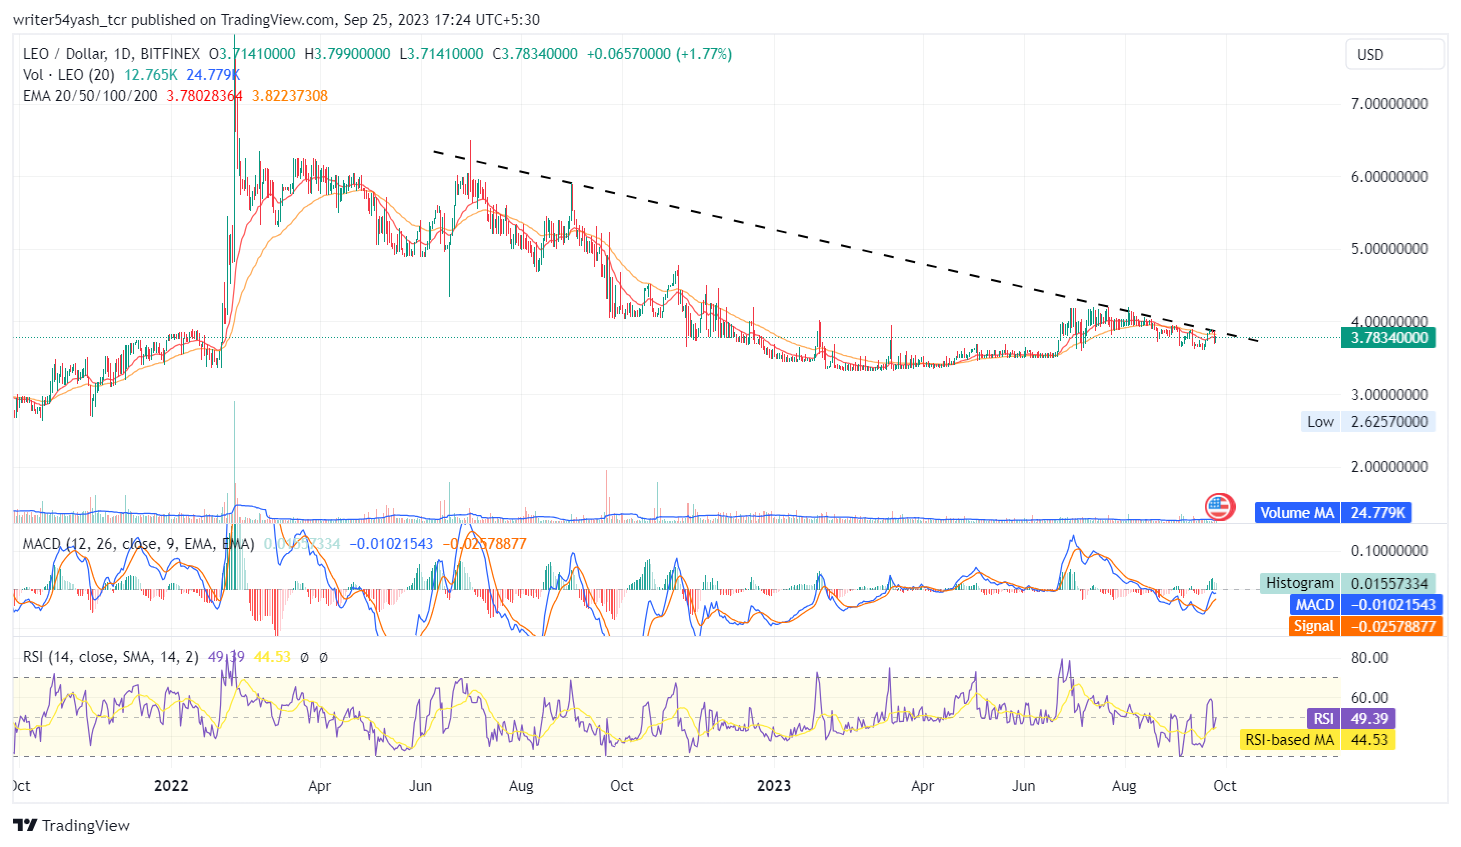
At the time of publishing, UNUS SED LEO (BITFINEX: LEO) is trading below the 20, and 50-day EMAs (exponential moving averages) which are rejecting the LEO price trend.
The MACD line at 0.01023138 and the signal line at 0.02579196 are both under the zero line and are crossing each other. The histogram gap is narrow in the MACD oscillator, which shows that the price is consolidating.
The RSI value is 49.38 points and the 14-day SMA is 44.53 points, which is below the middle line. This means that the price is bearish.
LEO has been weak in the last month, losing 2.32% of its value and dropping by 2.53% in the last three months. UNUS SED LEO (BITFINEX: LEO) has a negative annual return of 11.36%.
Conclusion
The LEO price shows the negative outlook and expectations of the investors and traders about the LEO in the daily chart. UNUS SED LEO price movement shows a bearish trend at the time of writing as LEO is under the trendline resistance and is moving sideways. Furthermore, the technical indicators of the UNUS SED LEO price suggest that the consolidation may turn into a downtrend on the daily chart. The MACD, RSI, and EMA are giving negative signals about the LEO price.
Technical Levels:
- Support Levels: $3 and $2.
- Resistance Levels: $4 and $5.
Disclaimer
In this article, the views and opinions stated by the author, or any people named are for informational purposes only, and they don’t establish the investment, financial, or any other advice. Trading or investing in cryptocurrency assets comes with a risk of financial loss.

With a background in journalism, Ritika Sharma has worked with many reputed media firms focusing on general news such as politics and crime. She joined The Coin Republic as a reporter for crypto, and found a great passion for cryptocurrency, Web3, NFTs and other digital assets. She spends a lot of time researching and delving deeper into these concepts around the clock, and is a strong advocate for women in STEM.


