
 Home
Home News
News
- 1 IMI PLC stock price: The stock price has been in a slight uptrend since September of last year.
- 2 The management increased the dividend payout by more than 112% for September.
- 3 The current price is just taking off from support, see whether it is the time to buy.
The engineering company (LON: IMI) may not be a large-cap stock, but it has been in the spotlight for its significant price fluctuations on the London Stock Exchange over the past few months. The IMI stock price soared to £1670 at one point and later dropped to as low as £1394 in April.
Financial Snapshot
Despite the fluctuations, IMI has been making steady progress in its financial performance. Looking at the company’s report, IMI is making up decent revenues quarterly, with growing numbers each quarter. In June 2023, the revenue cloaked £11B, which was an impressive 11.5% growth on a year-on-year basis. Meanwhile, the pretax profits increased by 15% in the same duration
The increment of dividends
One of the major announcements that has catered to everyone’s attraction is the board’s announcement of a payout increment. The periodic dividend increased on the 15th of September to £0.17, with investors receiving 112% more than last year’s £0.08. The payout ratio in 2022 was 29% of the net profit. It is a promising development for investors, who are always on the lookout for companies that offer a good return on investment.
Technical Analysis and Prediction of IMI Stock Price
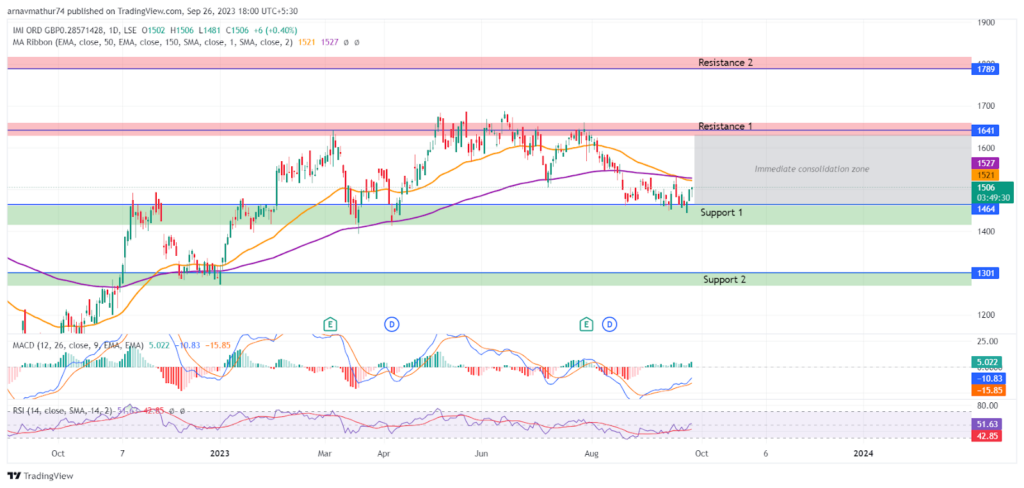
The IMI stock price is trading at the level of £1502 after coming back from the support level of £1464. As the bulls are trying to push the price towards its immediate resistance of £1641, the EMAs are looking to be a hurdle.
As the price fell to its support level a few days back, the 50-day EMA, which is at £1521, and the 150-day EMA, which is at £1527, made a bullish comparison. However, the trend may reverse if the bulls pass these EMA levels.
The RSI, on the other hand, is in an uptrend. The Simple moving average line of the RSI is at 42 and supports the RSI line, which is currently at 51, in a neutral zone of strength. The MACD graph is also following the likes of RSI, as the MACD line and its EMA are traveling towards the neutral zone of zero. At present, the MACD line is at -10.8 and its EMA is at -15.8.
Conclusion
the IMI stock is a mid-cap share floating with the big players. Recently, the stock has fluctuated like a roller coaster and the company announced an increment in the dividends for the shareholders. The IMI stock price prediction will be bullish if the investors can sustain the price past the levels of the EMAs. Otherwise, the stock will move to its 2nd support level of £1301.
Technical Levels
Support: £1464, and £1301
Resistance: £1641, and £1789
Disclaimer
The views and opinions stated by the author, or any people named in this article, are for informational purposes only. They do not establish financial, investment, or other advice. Investing in or trading crypto assets comes with a risk of financial loss.
Steve Anderson is an Australian crypto enthusiast. He is a specialist in management and trading for over 5 years. Steve has worked as a crypto trader, he loves learning about decentralisation, understanding the true potential of the blockchain.


