
 Home
Home News
News
- 1 Celo’s price (CELO) slid 3.02% in the past 24 hours and is currently trading at $0.448.
- 2 The daily chart shows that Celo’s price has undergone a consolidation of over 40 days.
- 3 CELO crypto price is struggling to sustain near the 50-day EMA.
Celo crypto price analysis elaborates a consolidation of the price over the daily chart. The intensity of the consolidation has been over 40 days and is in the 12-15% range. The CELO crypto price is unable to decide a clear trend as of now. The bulls and bears are struggling to dominate the trend.
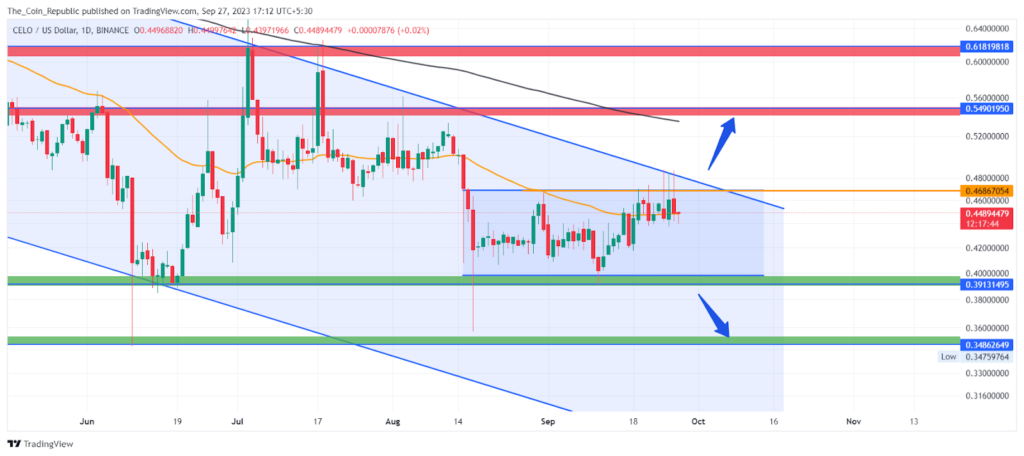
The CELO daily chart shows that the price trend favored the bears and the price seemed to respect a descending channel pattern. The price declined rolling between the upper and lower boundary of the channel. Moreover, the current price action seems to form a double bottom pattern over the daily chart.

The technical indicators imply that the CELO crypto price is trying to sustain near the 50-day EMA and trades at the upper boundary of the descending parallel channel pattern. The crypto price trades below the 200-day EMA indicating weakness over the charts.
Celo is a carbon-negative, blockchain platform that enables anyone with a mobile phone to use Web3 dApps for a more inclusive financial system. It has a proof-of-stake consensus, CELO governance token, and Mento stablecoins (cUSD, cEUR, cREAL) for real-world transactions.
Celo Price Shows Accumulation Over The Daily Chart
The Celo price currently trades at $0.448 with an intraday loss of 3.02%. The crypto price prediction states that CELO crypto might be accumulating buying volume at the lows and show a breakout in the upcoming sessions. The overall trend is indecisive at the moment and if bears dominate then the price might show a breakdown and decline to the lower levels.
The overall crypto market has shown positive trends in recent sessions. Hence, CELO might show price hikes to the upper levels if breaks out. Also, the volume analysis shows that the crypto has received $16.70 Million in the past 24 hours. The volume is down by 31.28% from the last day. The volume-to-market cap ratio of the CELO crypto is 7.22 indicating a mild volatility.
Technical Indicators Show Optimistic Signals for CELO Crypto

At the time of writing, MACD lines are showing a positive crossover. The histogram bars are also being formed above the mean line of constant height, indicating an indecisive trend at the moment. The EMA analysis shows that the CELO price struggles to sustain near the 50-day EMA indicating the short-term buyers presence of buyers in the market. The price trades below the 200-day EMA indicating the long-term weakness prevailed.
Conclusion
Celo is a blockchain platform that aims to make Web3 dApps more accessible and inclusive. The CELO crypto price has been consolidating for over 40 days in a 12-15% range, forming a double-bottom pattern on the daily chart. The price is below the 200-day EMA, showing weakness, but near the 50-day EMA, showing support. The price may break out or break down depending on the market sentiment and volume. The current price is $0.448, down by 3.02%. The volume-to-market cap ratio is 7.22, indicating mild volatility.
Technical Levels
- Support Levels: $0.39 and $0.38.
- Resistance Levels: $0.468 and $0.549.
Disclaimer
The views and opinions stated by the author, or any people named in this article, are for informational purposes only and do not establish financial, investment, or other advice. Investing in or trading crypto or stock comes with a risk of financial loss.
Mr. Pratik chadhokar is an Indian Forex, Cryptocurrencies and Financial Market Advisor and analyst with a background in IT and Financial market Strategist. He specialises in market strategies and technical analysis and has spent over a year as a financial markets contributor and observer. He possesses strong technical analytical skills and is well known for his entertaining and informative analysis of the Financial markets.


