
 Home
Home News
News
- 1 IMB PLC stock price: The stock price has been in a downtrend after the bearish crossover of the EMAs.
- 2 The company is doing well operationally but its balance sheet is showing some weaknesses.
- 3 The current price is on the verge of breaking a major support level, see the levels in the stock below.
Imperial Brands PLC (LON: IMB) has performed well over the past three years, with a return of more than 40%. It is much higher when compared with the market return of 8.9% if the dividends are not taken into account.
However, the recent returns have not been as good, with shareholders seeing just a 5% return. It is worth investigating whether the company’s underlying financials have contributed to its long-term bullish trend.
The Financial Snapshot of Imperial Brands PLC
In September 2022, the total revenue generated by using the firm was $16.92B. The sales grew by 2% and the EBIT grew by more than 5% from the previous year. That suggests that the organization has controlled its promoting and widespread costs efficiently, which has extended its profits before interest and taxes
The IMB stock is classed as large-cap as its market capitalization is $14B. The price-to-earnings (P/E) ratio of the firm at the present time is an optimum value of 9.3. It shows a good value proposition for the price that the investors are paying. The stock is making respectable net profits each year, which has brought a good return on equity (ROE) of 30.5%. It is a good sign for investors, indicating that the company produces income efficiently
Balance Sheet Ratios
Within the balance sheet, the current ratio is in the decrease phase of 0.81, which may additionally cause a liquidity crunch in case of any unsystematic risk. The firm may also face problems within the short period if it cannot generate sufficient cash to fulfill its obligations.
Lastly, the debt-to-equity ratio is 1.4, which indicates an excessive debt on the enterprise. It means that the agency has taken on a large quantity of debt to finance its operations in comparison with its retained earnings from operations themselves
Technical Analysis and Prediction of IMB Stock Price
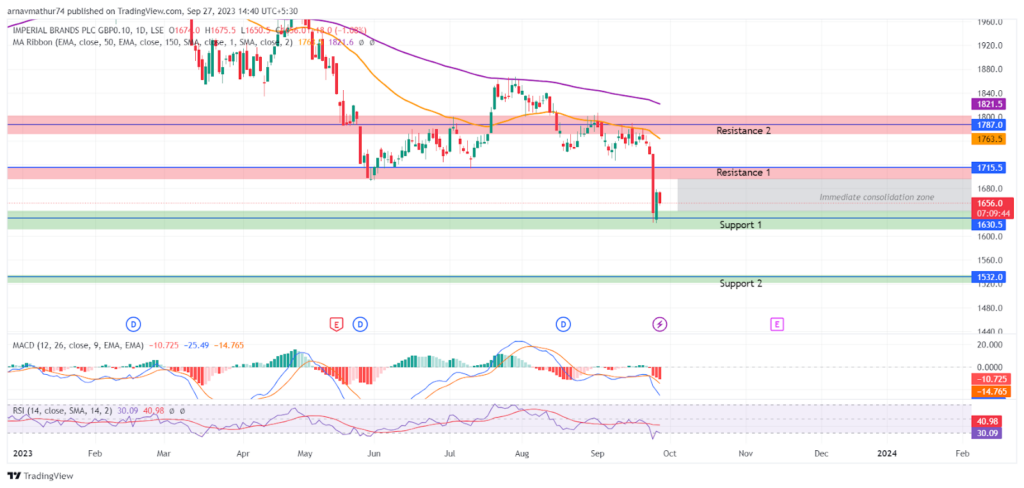
The IMB stock price is trading at $1656, just near the support level of $1715 at the press time. The current trend is a downtrend as the 50-day EMA and 200-day EMA have made a bearish crossover.
The current price has just broken major support, which is now the immediate resistance level at $1715. The price prediction of the IMB stock will be bearish as the bulls are facing rejection halfway from the resistance. The predicted trajectory is likely to break the current support level.
Conclusion
The IMB stock is a large-cap stock that has given good returns over the year beating the market. The company is keeping a good chunk of profits, but the balance sheet seems fragile. The current price has just broken a major support. It is predicted that another support is on the target for the bearish investors.
Technical Levels
Support: £1630, and £1532
Resistance: £1715, and £1787
Disclaimer
The views and opinions stated by the author, or any people named in this article, are for informational purposes only. They do not establish financial, investment, or other advice. Investing in or trading crypto assets comes with a risk of financial loss.

Andrew is a blockchain developer who developed his interest in cryptocurrencies while pursuing his post-graduation major in blockchain development. He is a keen observer of details and shares his passion for writing, along with coding. His backend knowledge about blockchain helps him give a unique perspective to his writing skills, and a reliable craft at explaining the concepts such as blockchain programming, languages and token minting. He also frequently shares technical details and performance indicators of ICOs and IDOs.


