
 Home
Home News
News
- 1 XRP price is in a narrow congestion zone, suggesting low investor interest.
- 2 Buyers have lost momentum and are yet to pull back.
XRP is in a narrow congestion zone near $0.5050. Consolidation suggests lack of strong buying and selling intent. Moreover, the price action shows that buyers still need to attain a relevant pullback amid the downtrend and persist in facing the headwinds. Furthermore, the chart structure shows the lower low sequence indicating seller dominance. Moreover, buyers lost strength and did not sustain near the neutral zone of $0.5000.

XRP price is below neutrality and is heading to the oversold region, showing low investor interest. Besides the downtrend, XRP price is in an uptrend in the symmetrical triangle pattern. Buyers are willing to surpass the trendline above $0.5300. Furthermore, the trajectory swings of $0.5500 need to be escaped to gain momentum, and it could trap the bears too.

At press time, XRP price is $0.5052 with an intraday drop of 1.09%, showing bearishness on the charts. Moreover, the trading volume increased by 2.76% to $752.42 Million, and the pair of XRP/BTC is at 0.0000189 BTC. The market cap of XRP is $26.90 Billion. Furthermore, analysts have given a sell rating and suggested a negative outlook for the upcoming sessions,
XRP price is trading close to the 20-day EMA, whereas sellers have already attained strength and need a little momentum to break the lower neckline of $0.5000. If it happens, XRP will retest the lower trajectory of $0.4500 in the following sessions.
Will XRP Attain a Rebound Above $0.5300?
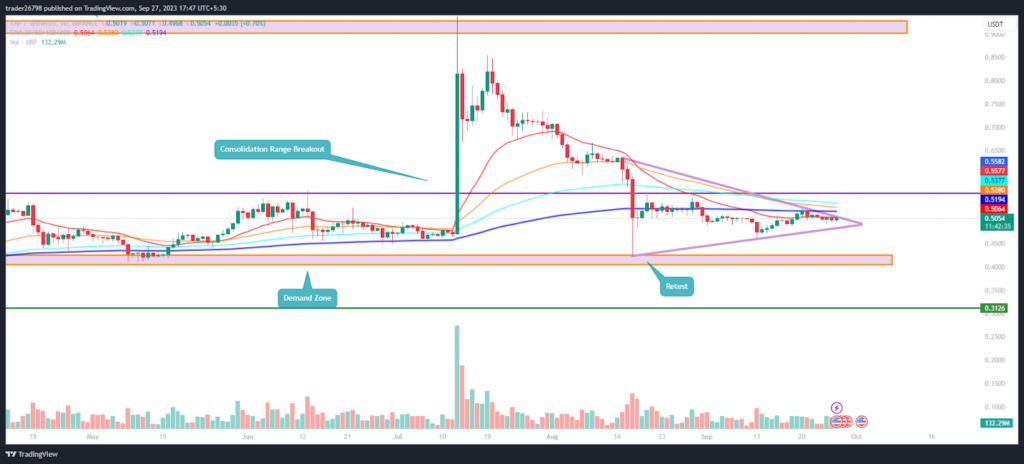
On the short term charts, the price action indicates short buildups and has not given any signs of a rebound. On a positive note, bulls have managed the gains instead of a frequent selloff and are trying to surpass the upper trendline of the symmetrical triangle pattern above $0.5300.
Short Term Chart Shows Signs of Reversal
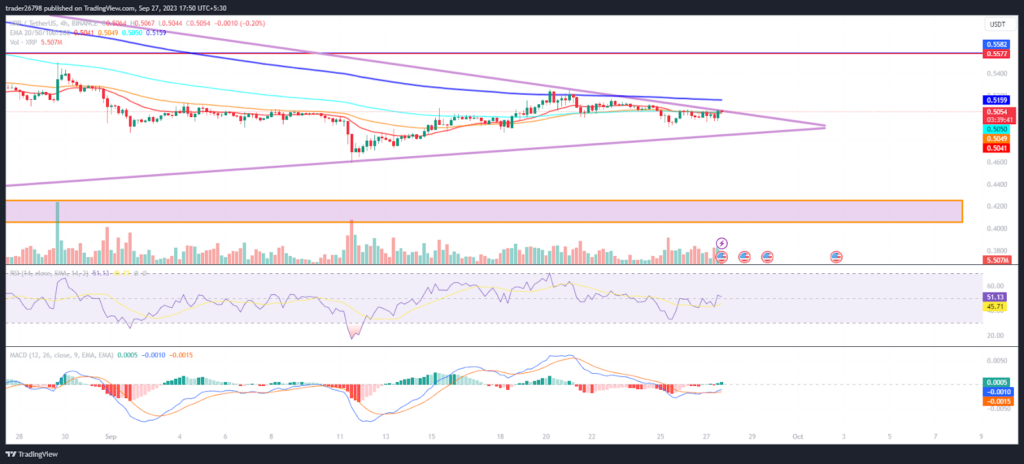
On the 4-hour charts, XRP price is close to the neckline of $0.5100, and buyers have attempted to surpass it, which may lead to a bounce. Furthermore, XRP price has supported the 38.2% Fib zone.
The RSI curve is close to the 50 neutral region, showing a bullish divergence and suggesting a short-term bounce to $0.5200.
The MACD shows a bullish crossover and green bars on the histogram, suggesting significant upswing may be probable if XRP sustains above $0.5100.
Summary
XRP price is in a narrow range and faced a downtrend over the past number of sessions. However, the lower lows formation is over and bulls are looking to take a step toward the reversal and sustaining the gains close to the 20-day EMA. Furthermore, the trend shows consolidation. The Bollinger band is contracting, a sign of the breakout, which could be seen in the upcoming sessions.
Technical Levels
Support Levels: $0.5000 and $0.4800
Resistance Levels: $0.5300 and $0.5500
Disclaimer
The views and opinions stated by the author or any other person named in this article are for informational purposes only and do not constitute financial, investment, or other advice. Investing in or trading crypto or stocks comes with a risk of financial loss.

Nancy J. Allen is a crypto enthusiast, with a major in macroeconomics and minor in business statistics. She believes that cryptocurrencies inspire people to be their own banks, and step aside from traditional monetary exchange systems. She is also intrigued by blockchain technology and its functioning. She frequently researches, and posts content on the top altcoins, their theoretical working principles and technical price predictions.


