
 Home
Home News
News
- 1 SQ stock price fell 23% in September 2023.
- 2 Block stock price (NYSE: SQ) is trading near the 52-week low.
- 3 Square stock price looks highly oversold and the risk of the squeeze is high.
Block Inc., SQ stock price fell 23% in the previous month and formed a giant bearish candle. It showed a steep fall and formed a highly bearish pattern.
Block stock price broke down the crucial support of 55.00 which fueled the downside momentum. In September, Square’s stock price continuously declined by forming lower lows and eroded a big portion of its market capitalization.
The recent downfall in the SQ stock price looks reliable and seems like some big investors have taken an exit.
SQ stock price is down by 31.53% on a YTD basis. It has corrected a lot from the recent with recent swing high so a narrow-range consolidation or a short-term pullback rally is needed.
Block stock price is in a downtrend and trading below the 50-day and 200-day EMA. It looks oversold and short sellers seem to be highly active.
Meanwhile, the broader market indices also reversing down and trading with a bearish bias. It negatively impacts the prices of SQ shares as well as other tech sector stocks.
Block Inc.’s stock price closed the previous session at $44.26 with an intraday decline of -0.20%. The market capitalization stands at $27.00 Billion.
Will SQ Stock Price Show Comeback in October?
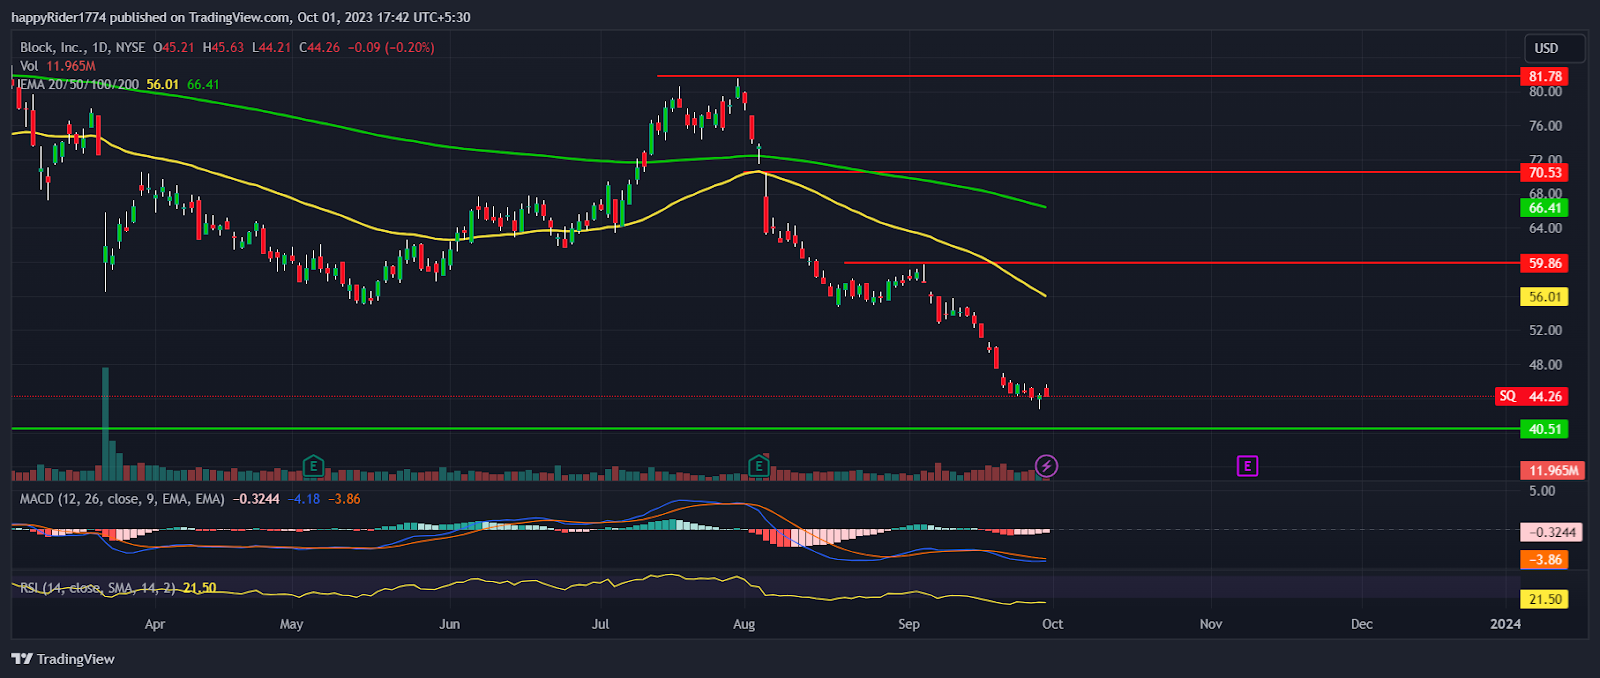
SQ stock price fell 15% in the 3rd week of September and hit a 52-week low at $42.77. The sellers look aggressive and continue their dominance on the higher levels.
Till the Block stock price is trading below $60.00 it is expected to remain in the bears’ grip. Any short-term pullback rally will face difficulty in the supply zone and the reliability of the up move will remain doubtful.
However, if buyers succeed in breaking the $60.00 hurdle then it may regain the confidence of the investors.
Block Stock Price has Fallen for Eight Consecutive Weeks
Block stock price has fallen for eight consecutive weeks. It indicates that investors are losing confidence in their business. Therefore, it is important for the company to turn profitable in the coming months.
The MACD curve is trading below the zero line and sloping downward indicates bearishness. The RSI curve at 21 denotes highly oversold territory. So a wild short covering rally may trigger anytime from the lower levels.
Conclusion
Block Inc.’s SQ stock price fell 23% in the previous month and eroded a big portion of its market capitalization. The technical analysis suggests the block stock price has corrected a lot so it is expected to consolidate in a narrow range.
Technical levels
- Resistance levels: $50.00 and $59.86
- Support levels: 40.51 and $35.00
Disclaimer
The views and opinions stated by the author, or any people named in this article, are for informational purposes only. They do not establish financial, investment, or other advice. Investing in or trading crypto assets comes with a risk of financial loss.

Andrew is a blockchain developer who developed his interest in cryptocurrencies while pursuing his post-graduation major in blockchain development. He is a keen observer of details and shares his passion for writing, along with coding. His backend knowledge about blockchain helps him give a unique perspective to his writing skills, and a reliable craft at explaining the concepts such as blockchain programming, languages and token minting. He also frequently shares technical details and performance indicators of ICOs and IDOs.


