
 Home
Home News
News
- 1 COST stock price is trading close to the neckline of $570.
- 2 Buyers are willing to register a breakout and want to reach $600.
Costco Wholesale Corporation (COST stock) price is trading in an uptrend and has shown breakout indications in the past sessions. COST stock price is trading close to the crucial neckline of $570, which, if surpassed, flies toward $600. Moreover, COST stock price is trading above the significant moving averages, showing bullishness for the past sessions. Furthermore, the chart showcased the buyer interest and suggested that a significant upside toward $600 can be anticipated soon.
COST share price is trading in the bull trajectory and showed a V-shaped rebound from the 50-day EMA after retesting the support zone of $530. After that, buyers accumulated the stock, showed interest, and pulled back the price. Moreover, the chart shows the bull dominance and stock will skyrocket soon. As per the options chain, buyers are challenged to surpass the strike price of $570, a massive open interest of 706 hundred shares there, which shows a strong resistance zone. If price surpasses $575, the call writer of $570 trapped and a short covering rally toward $600 can be anticipated in the upcoming sessions.
At the press time, COST stock price is trading at $571.31 with an intraday gain of 1.12%, showing bullishness for the past sessions. Furthermore, the trading volume increased by 0.44% to 1.990 Million, and the market cap is $253.175 Billion. However, Analysts have maintained a buy rating with a yearly target price of $593.93, which suggests a strong growth outlook for the upcoming sessions.
Costco Wholesale Corp. engages in the operation of membership warehouses through wholly owned subsidiaries. It operates through the following geographical segments: United States, Canada, and Other International Operations. The company was founded by James D. Sinegal and Jeffrey H. Brotman in 1983 and is headquartered in Issaquah, WA.
Will COST Stock Attains Momentum Above $570?
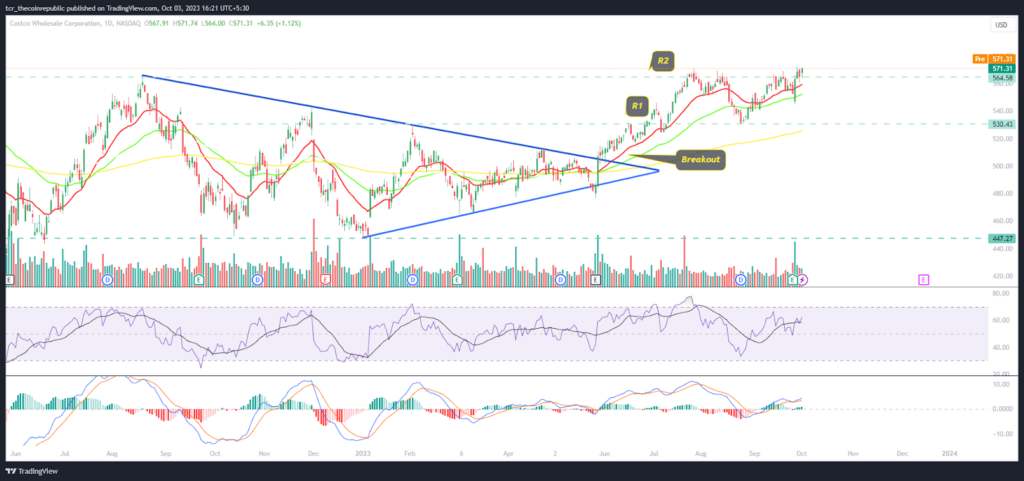
On the daily charts, COST stock price is close to the breakout region and is trading in the bullish trajectory from where further upside to $600 is possible in the upcoming sessions. Moreover, the price is trading above the 61.8% Fib level and is close to the upper Bollinger band, indicating a positive outlook.
The RSI curve stayed in the overbought zone showcasing a bullish divergence indicates a positive outlook for the upcoming sessions.The MACD indicator showed a bullish crossover and formed green bars on the histogram suggesting that COST stock will skyrocket soon.
Summary
COST stock price is trading above the key hurdle of $560 indicating bullishness for the past sessions. Moreover, the price action indicates that buyers have persisted in accumulating the stock and have attained momentum that will redirect COST stock to $600 and will flourish the glimpse of bullishness.
Technical Levels
Support Levels: $565 and $550
Resistance Levels: $575 and $600
Disclaimer
The views and opinions stated by the author or any other person named in this article are for informational purposes only and do not constitute financial, investment, or other advice. Investing in or trading crypto or stocks comes with a risk of financial loss.

Adarsh Singh is a true connoisseur of Defi and Blockchain technologies, who left his job at a “Big 4” multinational finance firm to pursue crypto and NFT trading full-time. He has a strong background in finance, with MBA from a prestigious B-school. He delves deep into these innovative fields, unraveling their intricacies. Uncovering hidden gems, be it coins, tokens or NFTs, is his expertise. NFTs drive deep interest for him, and his creative analysis of NFTs opens up engaging narratives. He strives to bring decentralized digital assets accessible to the masses.


