
 Home
Home News
News

- 1 Stellar crypto price has been in an extended downtrend.
- 2 XLM crypto price is trading below the key moving averages showing bearishness on the daily chart.
The price action of the Stellar crypto showed that selling pressure was noted on the charts and was in a downtrend, forming lower lows over the past few months. Moreover, due to declining investor interest, trading volume was below average.

Furthermore, Stellar showed a decline in user activity which also reacted as a negative sentiment for the crypto and led to bearishness in the charts.

The ongoing trend favors the bears, and the crypto was also in a corrective phase, which made buyers cautious. Moreover, the Stellar trades below the significant moving averages and tries to attain the 50-day EMA to hold the gains.
At the time of writing, the Stellar price is trading at $0.111481 with an intraday gain of -0.12%, showing a bounce from the lower trendline near the support mark of $0.110863. Moreover, the intraday trading volume is $78.057 Million and the market cap is $3.087 Billion.
Crypto has been volatile throughout the years. Year-to-date it gave positive returns of 56.60% and 3.63% in the span of 6 months. In the last 1 month, it gave a negative return of 2.09% and 1.52% in the last seven days. Indicating a long Bearish trend in recent times.
Technical Analysis of Stellar Crypto Price in 1-D Time Frame
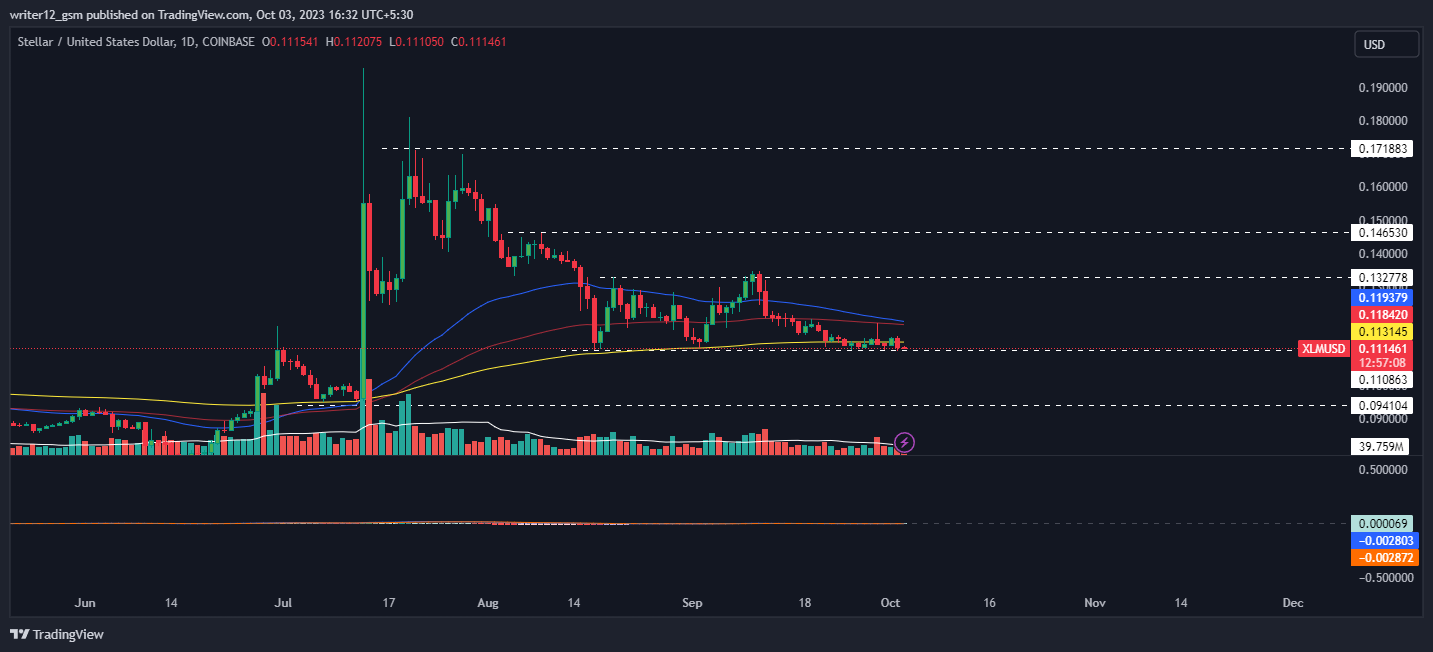
At the time of publishing, Stellar crypto (USD: XLM) is trading above the 50 and 200-day SMAs (simple moving averages), which do not support the price trend.
The current value of RSI is 38.88 points. The 14 SMA is below the median line at 39.87 points which indicates that the Stellar crypto is bearish.
The MACD line at -0.002810 and the signal line at -0.002873 are below the zero line. A bearish crossover is observed in the MACD indicator which signals more bearishness for the XLM crypto price.
4-Hour Time Frame Technical Evaluation
On the 4-hour charts, Stellar price is stuck in a narrow range and does not signal an upcoming rise because of low volume levels. Moreover, a key indicator is still in the neutral range and does not signal bullishness.
The RSI curve is near 40, in the neutral range, and showed a narrow consolidation move on the short-term charts. The MACD indicator still showed red bars on the histogram with a bearish crossover and did not signal any substantial upswing.
Summary
Stellar (USD: XLM) technical oscillators also support the bearish trend. The MACD, RSI, and EMAs are emphasizing negative signs and imply that the downtrend might continue in the XLM crypto price. Stellar price action suggests that the investors and traders are bearish on the 1-D time frame. The price action reflects a bearish perspective at the moment.
Technical Levels
- Support Levels: $0.110863 and $0.094104.
- Resistance Levels: $0.132778 and $0.146530.
Disclaimer
This article is for informational purposes only and does not provide any financial, investment, or other advice. The author or any people mentioned in this article are not responsible for any financial loss that may occur from investing in or trading. Please do your own research before making any financial decisions
Steve Anderson is an Australian crypto enthusiast. He is a specialist in management and trading for over 5 years. Steve has worked as a crypto trader, he loves learning about decentralisation, understanding the true potential of the blockchain.


