
 Home
Home News
News
- 1 Mina price (MINA) declined 2.37% in the past 24 hours and is currently trading at $0.382.
- 2 The daily chart illustrates a consolidation of over 40 days.
- 3 MINA price struggles to surpass the 50-day exponential moving average.
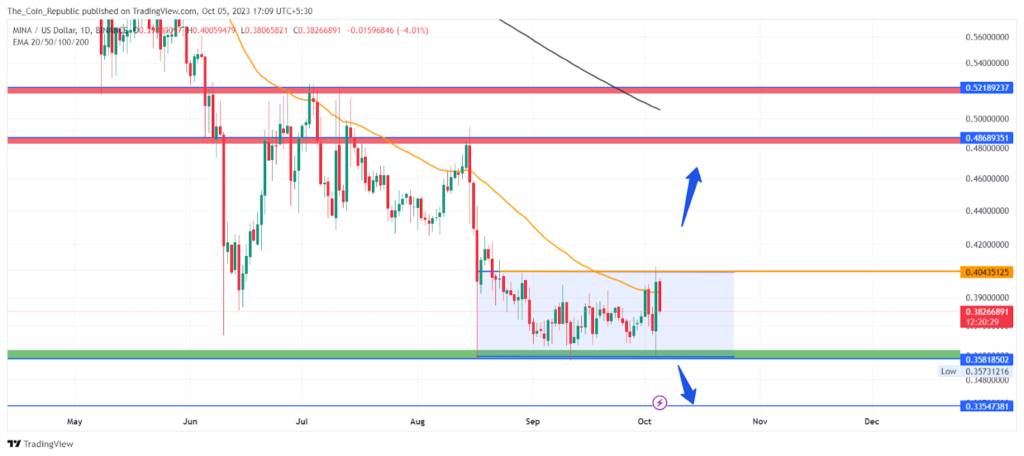
Mina price analysis illustrates that the MINA price has shown bearishness in the last two months. The price declined near the previous swing low wiping the previous gains of June. The 50-day EMA acted as a major dynamic support for the Mina crypto price.
Currently, MINA price is down by nearly 2.37% intraday. The daily chart demonstrates a consolidation of over 40 trading sessions. The price is hovering between the upper and lower boundary of the consolidation and unable to find a direction.
The overall crypto market is bullish in the short term which Mina crypto may benefit if the price shows a breakout. The breakout above $0.404 may invite more intraday buyers and the price may show a hike of over 10% in intraday. Moreover, the more the consolidation, the more intense will be the breakout.
The technical indicators suggest that the MINA price currently trades near the 50-day EMA and shows frequent crossover with the price indicating the indecisive trend at the moment in the short run.
Mina Price Might Escape The Consolidation
The average analyst price target for MINA token in 2023 is $0.55, which represents a potential upside of 48% from the current price. However, there is a wide range of analyst price targets, from $0.2 to $0.75.
The volume analysis shows that MINA crypto received $25.475 Million in the past 24 hours, which is 75.33% more than the last day. The crypto holds a market cap of $372.2 Billion and ranks 82nd in the crypto market. The volume to market-cap ratio is 7.91% indicating mild volatility in the market.
Technical Indicators Show Indecisive Trend At The Moment
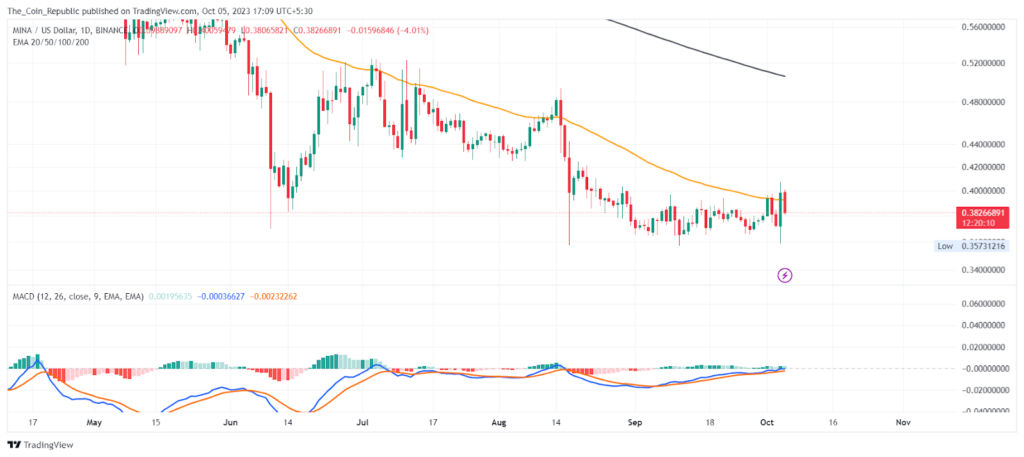
MACD lines have gone flat. The histogram bars are also being formed of negligible height indicated a consolidation and an indecisive trend at the moment.
The EMA analysis shows that the MINA price trades below the 200-day EMA indicating a long-term bearish trend. The frequent crossover of the price with the 50-day EMA indicates a sideways trend in the short term.
Conclusion
Mina price has been consolidating for 40 days between $0.404 and $0.2. The price is near the 50-day EMA and shows no clear direction. The market is bullish and a breakout above $0.404 may lead to a 10% rise. The average analyst price target for 2023 is $0.55, with a range of $0.2 to $0.75. The volume increased by 75.33%, indicating mild volatility. The market cap of MINA is $372.2 Billion.
Technical Levels
- Support Levels: $0.35 and $0.33
- Resistance Levels: $0.48 and $0.52
Disclaimer
The views and opinions stated by the author, or any people named in this article, are for informational purposes only and do not establish financial, investment, or other advice. Investing in or trading crypto or stock comes with a risk of financial loss.

Andrew is a blockchain developer who developed his interest in cryptocurrencies while pursuing his post-graduation major in blockchain development. He is a keen observer of details and shares his passion for writing, along with coding. His backend knowledge about blockchain helps him give a unique perspective to his writing skills, and a reliable craft at explaining the concepts such as blockchain programming, languages and token minting. He also frequently shares technical details and performance indicators of ICOs and IDOs.


