
 Home
Home News
News
- 1 Optimism price currently trades at $1.331 while witnessing a 0% change during the intraday trading session.
- 2 OP price has plunged below 20, 50, 100, and 200-day exponential moving averages.
- 3 The year-to-date return of Optimism is 44.88%, while the monthly return is -0.82%.
Optimism (OP) price fell since the bullish move commenced in the middle of June and was halted at $1.81. The cryptocurrency price entered a bullish trend in June, rising from the support level of $1.18 and forming an August high of $1.829.
The rally was initiated after the release of news regarding BlackRock, an investment banking firm, filing for Bitcoin Spot ETF. OP’s price faced rejection from $1.81 and started to retrace. Currently, OP price seems stuck in a narrow consolidation zone, ranging between $1.24 and $1.42.

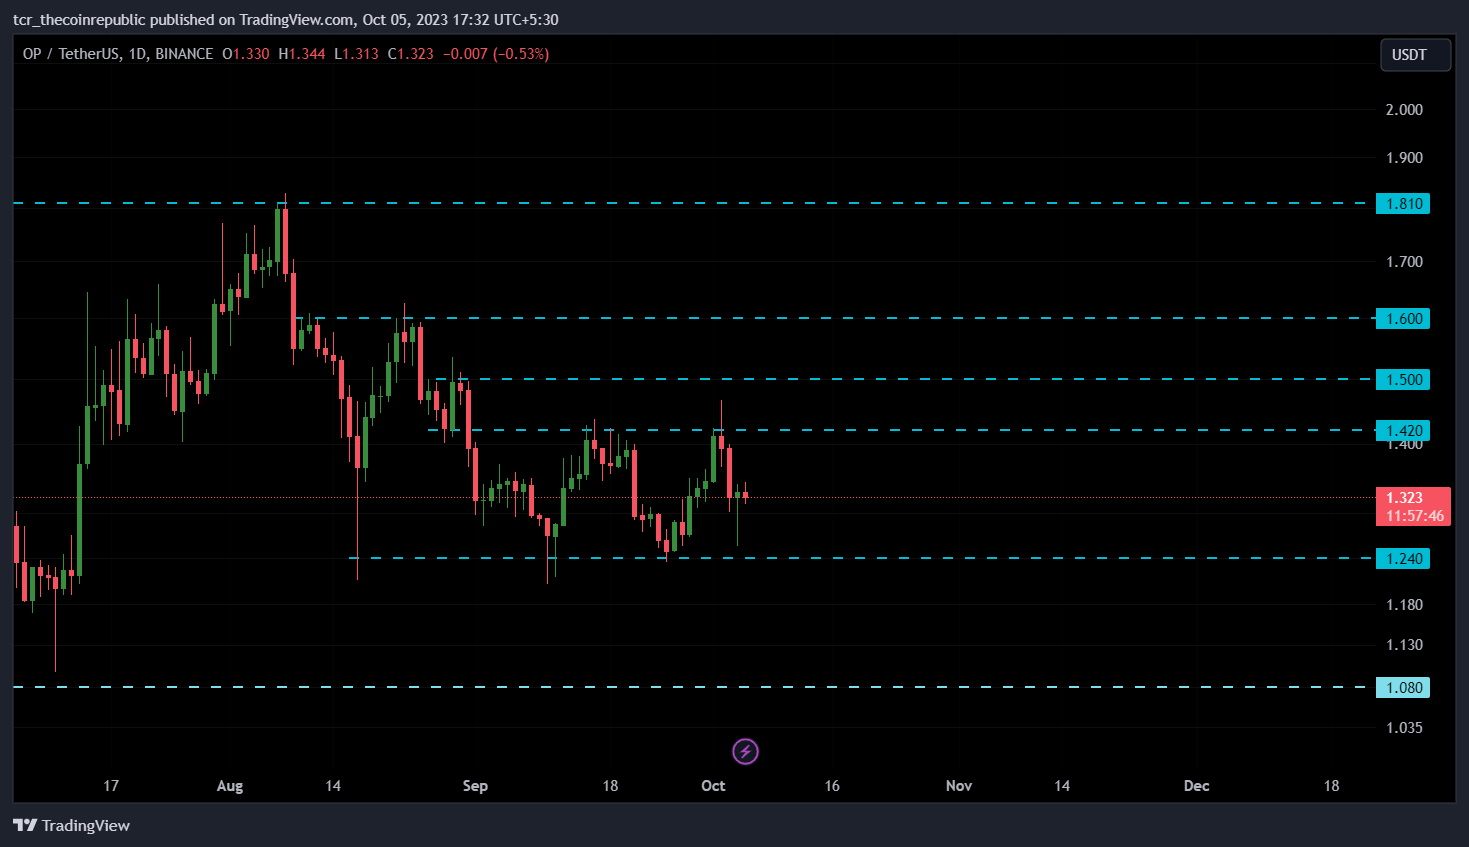
If bulls can push the price above $1.42, it might rise and retest the next psychological level of $1.50 and $1.60. On the other hand, if bears can push the prices below $1.24, the OP price might melt to $1.08.
Network Activity of Optimism
The daily active addresses of Optimism have witnessed a notable drop of 33.8% in the past 30 days, coming down to 56,915. The daily active addresses peaked on 20 July, reaching 161,720.
The daily transactions have been sliding down since the start of August. In the last 30 days, there has been a drop of 24.7% in the daily transactions, dropping to 281,744.
The total value locked has also declined 21.3%, reaching $649 Million. The decentralized exchange volume has also plunged 16.7% to $30.1 Million in the last three months. The market capitalization witnessed a rise of 1.33% in the market capitalization at the time of writing. However, the 24-hour trading volume dropped by 35.43%.
Optimism price is up 228.08% from the all-time low of $0.4005 and down 71.24% from the all-time high of $4.57.
Will OP Price Break Consolidation in a Downward Direction?
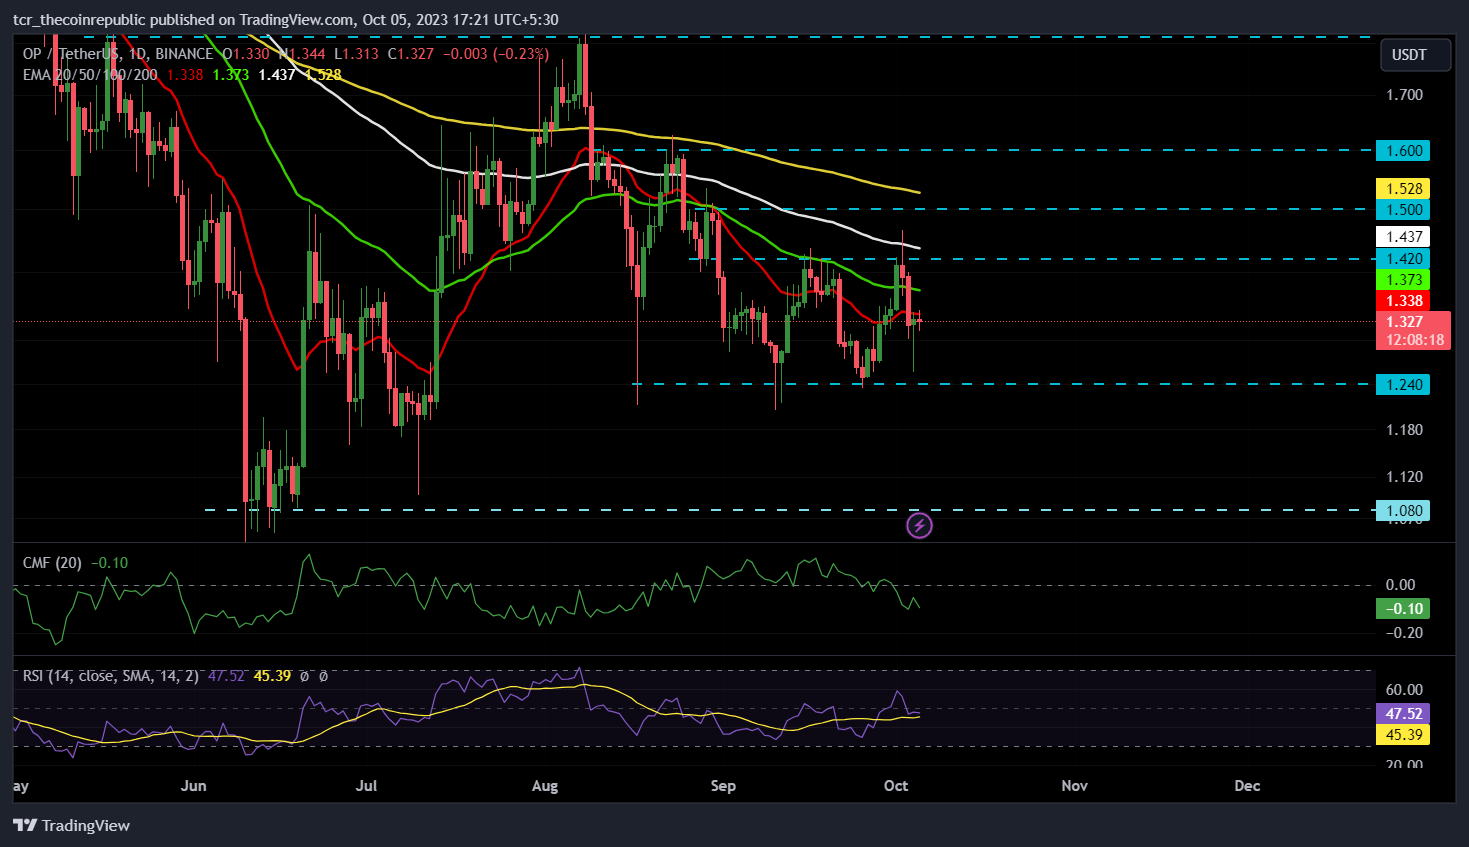
The cryptocurrency price has surged above 20, 50, 100, and 200-day exponential moving averages, suggesting bullish momentum. LINK price is bouncing off the 20-day EMA.
The Chaikin money flow score hovers below the 0 mark and trades at -0.10, indicating capital outflow and weakness in the market. The relative strength index has dropped below the 50 neutral mark and has melted to 47.27, implying that the OP price faces the same pressure from bulls and bears.
The long-short ratio is 0.94, with 48.56% longs and 51.44% shorts, signifying a higher position of sellers in the last 24 hours.
Conclusion
Optimism protocol activity is currently facing challenges. Daily active addresses, daily transactions, and Total Value Locked (TVL) have dropped significantly in the last 90 days. The overall market structure and price action are still bearish.
Technical Levels
Major support: $1.24 and $1.08
Major resistance: $1.60 and $1.81
Disclaimer
The views and opinions stated by the author, or any people named in this article, are for informational purposes only. They do not establish financial, investment, or other advice. Investing in or trading crypto assets comes with a risk of financial loss.

Andrew is a blockchain developer who developed his interest in cryptocurrencies while pursuing his post-graduation major in blockchain development. He is a keen observer of details and shares his passion for writing, along with coding. His backend knowledge about blockchain helps him give a unique perspective to his writing skills, and a reliable craft at explaining the concepts such as blockchain programming, languages and token minting. He also frequently shares technical details and performance indicators of ICOs and IDOs.


