
 Home
Home News
News
- 1 Cosmos crypto price is currently trading at $6.898 with a rise of 0.94% in the last 24 hours with a current market cap of $ 2.539 Million.
- 2 Cosmos crypto price decreased by 2.97% over the past seven days.
The price action of the Cosmos crypto showed that selling pressure was noted on the charts and was in a downtrend, forming lower lows over the past few months. Moreover, due to declining investor interest, trading volume was below average.
Furthermore, the Cosmos showed a decline in user activity which also reacted as a negative sentiment for the crypto and led to bearishness in the charts.
The ongoing trend favors bears, and the crypto was also in a corrective phase, which made buyers cautious. Moreover, Cosmos is below the significant moving averages and tried to attain the 50-day EMA to hold the gains.
At the time of writing, the Cosmos price was trading at $6.898 with an intraday gain of 0.94%, showing a rejection from the upper trendline near the resistance mark of $7.292. Moreover, the intraday trading volume increased is $59.998 Million while the market cap is $2.538 Billion.
Crypto has had a poor performance over the years. Year-to-date it gave negative returns of -26.23% and -37.13% in the span of 6 months. In the last 3 months, it gave a negative return of -24.82% and 3.00% in the last seven days highlighting a long bearish trend.
Technical Analysis of Cosmos Crypto Price in 1-D Time Frame
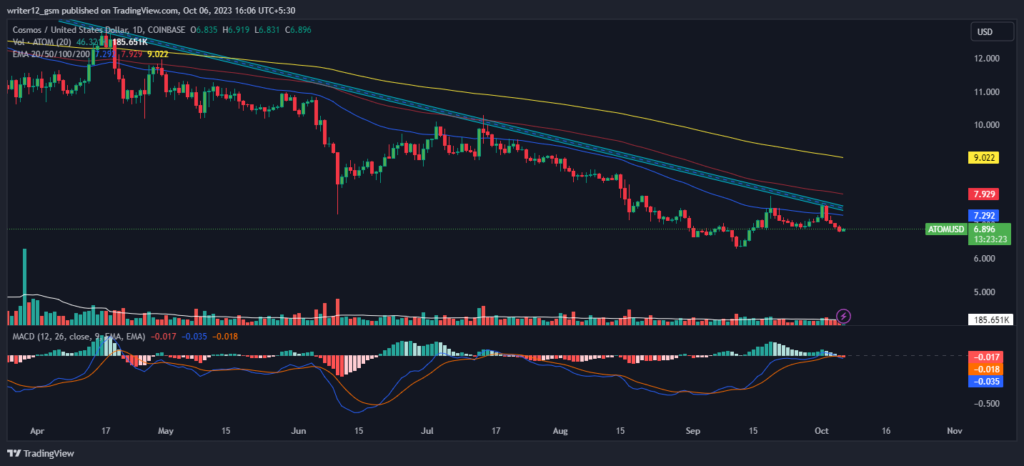
At the time of publishing, Cosmos crypto (USD: ATOM) was above the 50 and 200-day simple moving averages (SMAs), which are not supporting the price trend. The current value of RSI is 44.92 points. The 14 SMA is above the median line at 48.96 points which indicates that the Cosmos crypto is bearish.
The MACD line at -0.035 and the signal line at -0.018 are below the zero line. A bearish crossover is observed in the MACD indicator which signals more bearishness for the ATOM crypto price.
4 Hour Time Frame Technical Evaluation
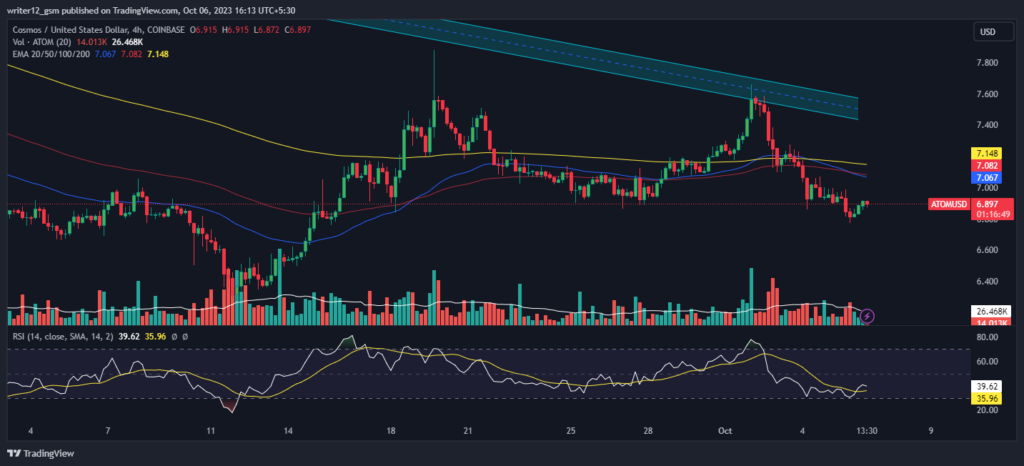
On the 4-hour charts, the Cosmos price is stuck in a narrow range and does not signal an upcoming rise because of low volume levels. Moreover, a key indicator is still in the neutral range and does not signal bullishness. The RSI curve is near 40, in the neutral range, and showed a narrow consolidation move on the short-term charts.
The MACD shows green bars on the histogram with a bullish crossover but did not signal any substantial upswing.
Summary
Cosmos (USD: ATOM) technical oscillators highlight a bearish trend. The MACD, RSI, and EMAs are emphasizing negative signs and imply that ATOM crypto price is in a downtrend. Cosmos price action suggests that the investors and traders are bearish on the 1-day time frame. The price action reflects a bearish perspective at the moment.
Technical Levels
- Support Levels: $7.929 and $9.022.
- Resistance Levels: $5.554 and $6.278.
Disclaimer
This article is for informational purposes only and does not provide any financial, investment, or other advice. The author or any people mentioned in this article are not responsible for any financial loss that may occur from investing in or trading. Please do your own research before making any financial decisions

Nancy J. Allen is a crypto enthusiast, with a major in macroeconomics and minor in business statistics. She believes that cryptocurrencies inspire people to be their own banks, and step aside from traditional monetary exchange systems. She is also intrigued by blockchain technology and its functioning. She frequently researches, and posts content on the top altcoins, their theoretical working principles and technical price predictions.


