
 Home
Home News
News

- 1 Cardano price prediction showcases the fall of ADA crypto over the daily time frame chart.
- 2 ADA crypto slipped below the 20, 50, 100, and 200-day daily moving averages.
- 3 Cardano cryptocurrency managed to gain around 2.15% year-to-date.
Cardano price prediction showcases the fall of ADA crypto through a declining streak over the daily time frame chart. Meanwhile, buyers need to accumulate in order to push ADA upwards. However, ADA crypto has been slipping towards the lower trendline of the consolidation phase. ADA crypto had an interesting roller coaster ride over the daily time frame chart.

Meanwhile, Cardano cryptocurrency is stuck inside the consolidation phase after breaking out of the descending triangle pattern over the daily time frame chart. ADA crypto gained to $0.26781714 and has been slipping after testing the resistance. Now buyers need to accumulate at a higher rate to push ADA upwards.

Cardano’s price was at $0.25065000 and lost 2.28% of its market capitalization during the day’s trading session. However, trading volume has increased by 20.14% during the intraday trading session. This demonstrates that buyers are still present in the trade to push ADA upwards. The volume-to-market cap ratio was at 1.82%.
Analyzing Cardano Price Technical Indications
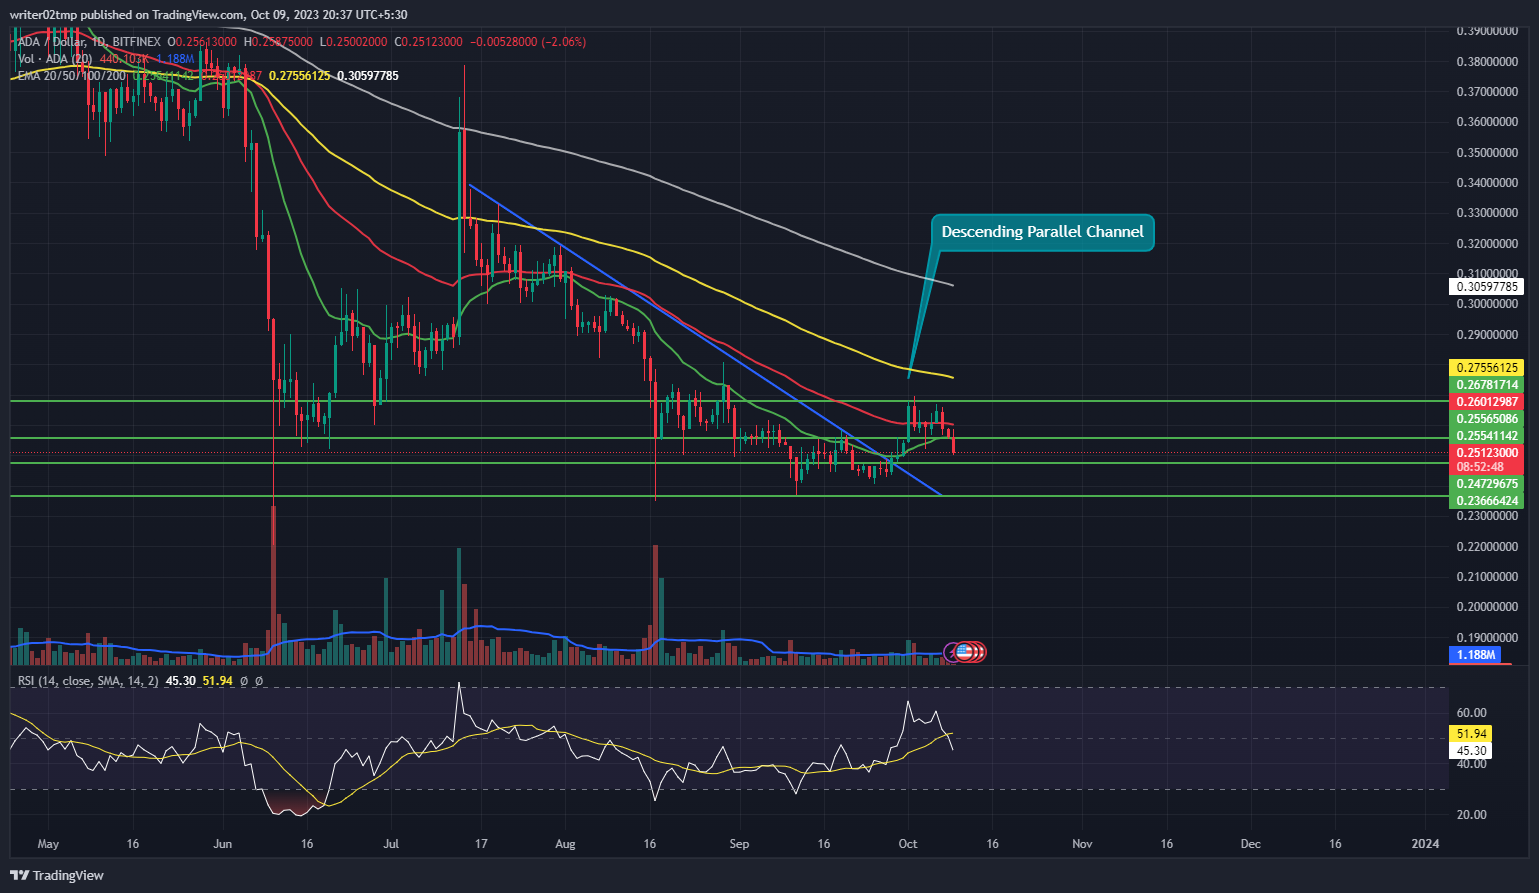
Cardano price prediction suggests a decline in ADA cryptocurrency towards the lower boundary of its consolidation phase. To initiate an upward movement, buyers must increase their accumulation. However, the current volume remains below average, indicating a need for growth during intraday trading. Furthermore, ADA crypto has dipped below the 20, 50, 100, and 200-day daily moving averages.
Cardano crypto price has experienced a 5.66% decline over the past week and a 1.25% dip within the last month. Over the last three months, ADA has faced a 12.90% decrease, which extended to 37.43% over the past six months. Despite these fluctuations, Cardano ADA’s price has achieved a 2.15% gain year-to-date.
Technical indicators suggest the fall of Cardano ADA price. The relative strength index confirms the decline of ADA price. RSI was at 45 and is moving towards the oversold territory. Investors in Cardano cryptocurrency need to wait for any directional change over the daily time frame chart.
Summary
Cardano price prediction showcases the fall of ADA crypto through a declining streak over the daily time frame chart. Meanwhile, Cardano cryptocurrency is stuck inside the consolidation phase after breaking out of the descending triangle pattern over the daily time frame chart. However, the current volume remains below average, indicating a need for growth during intraday trading. Despite these fluctuations, Cardano ADA’s price has achieved a 2.15% gain year-to-date.
Technical Levels
Support Levels: $0.24718173 and $0.23666424
Resistance Levels: $0.0.26781714 and $0.28096996
Disclaimer
The views and opinions stated by the author, or any people named in this article, are for informational purposes only, and they do not establish financial, investment, or other advice. Investing in or trading crypto or stock comes with a risk of financial loss.

With a background in journalism, Ritika Sharma has worked with many reputed media firms focusing on general news such as politics and crime. She joined The Coin Republic as a reporter for crypto, and found a great passion for cryptocurrency, Web3, NFTs and other digital assets. She spends a lot of time researching and delving deeper into these concepts around the clock, and is a strong advocate for women in STEM.


