
 Home
Home News
News
- 1 Trust Wallet Token price (TWT) slid 4.21% in the past 24 hours and is currently trading at $0.953.
- 2 The daily chart shows that Trust Wallet Token’s price seems to be losing momentum after a bullish rally.
- 3 Trust Wallet Token crypto price showed a breakout of the 50-day EMA indicating that it might turn a dynamic support for the price if the price declines.
Trust Wallet Token crypto price analysis demonstrates that the price seems to be losing momentum near the 200-day EMA and is down nearly 6.4% in the last 2 intraday sessions. The daily chart illustrates the formation of a pin bar candle near the supply zone after which the price is down over 4% in Intraday and might show more decline in the price by the end of the session.
The price trend illustrates that the crypto price recently witnessed a breakout of a bullish flag channel pattern turning the short-term trend in the favor of buyers. The recent price hike saw a price surge of almost 28% in just five Intraday sessions.
Moreover, the price might be coming down due to profit booking as the short-term surge might have triggered a profit booking. The technical indicators imply that the crypto price had made a breakout above the 50-day EMA indicating a short-term optimistic trend might prevail.
The volume analysis shows that the TWT crypto has received $52.8 Million in volume in the past 24 hours which is almost 54.19% less than the last day’s volume. The crypto holds a market cap of $400.2 Million and ranks 76th in the overall crypto market. The volume-to-market cap ratio is 13.37% indicating mild volatility in the crypto.
Trust Wallet Token Price Suffered Rejection From 200-Day EMA
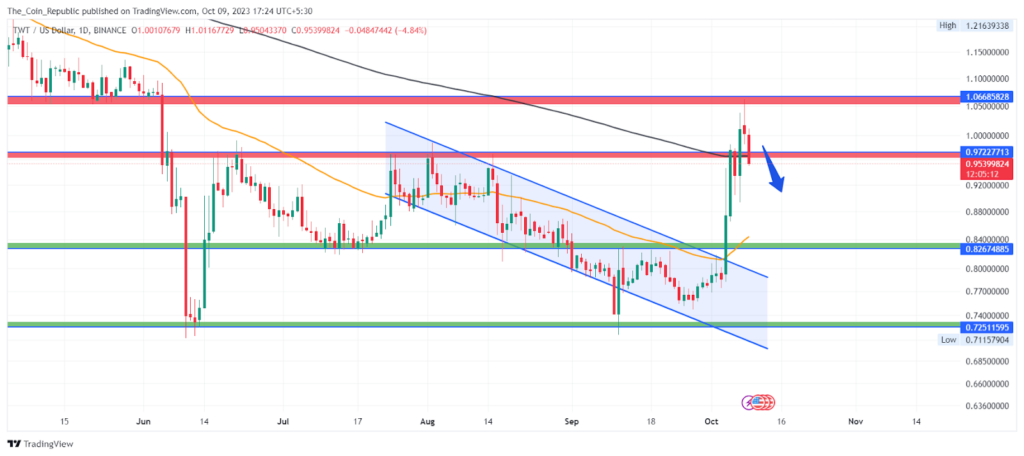
Currently, the price trades at $0.953 and is down 4.21% in Intraday. The TWT crypto price trades above the 50-day EMA which might act as a dynamic support and surge the price to upper supply levels. The price has suffered from the 200-day EMA indicating the dominance of sellers near the upper levels.
Technical Indicators Show Bullish Momentum Fading

MACD lines are showing an optimistic crossover. The histogram bars are also being formed above the mean line of decreasing height, indicating that the bulls are losing momentum and the price might show dips in the short term.
The EMA analysis depicts that the TWT price shows the breakout of the 50-day EMA indicating an optimistic trend prevailing in the short term. The EMAs might act as a dynamic support if the price approaches it.
Conclusion
Trust Wallet Token crypto shows the breakout of a bullish flag pattern in the recent sessions and surged almost 28% in just five sessions. However, the last two sessions have been seller-dominated and the price has observed a significant decline of over 6% indicating the fading momentum of buyers. The price might decline more in the upcoming session if buyers fail to accumulate at CMP. However, the TWT price trades above the 50-day EMA which might turn a major support and halt the decline further.
Technical Levels
- Support Levels: $0.826 and $0.725.
- Resistance Levels: $0.972 and $0.1.066.
Disclaimer
The views and opinions stated by the author, or any people named in this article, are for informational purposes only and do not establish financial, investment, or other advice. Investing in or trading crypto or stock comes with a risk of financial loss.
Steve Anderson is an Australian crypto enthusiast. He is a specialist in management and trading for over 5 years. Steve has worked as a crypto trader, he loves learning about decentralisation, understanding the true potential of the blockchain.


