


Southwest Airlines Company (NYSE: LUV) stock price illustrates an accumulation after it slipped to a three-year low price. The stock price delivers a bearish outlook in the short-term as well as long term.
Furthermore, the price trend analysis elaborates that the LUV stock has persisted in a long-term declining trend since October 2021 when the price slipped below its 200-day EMA. Since then, the stock price has been in a major declining trend with some pullbacks in the short term which were later rejected by the 50-day and and 200-day EMA.
However, the last quarter saw the price bottoming out and surged to gain over 29%; breaking above the 50-day and 200-day EMA. But the current quarterly results triggered a gap down followed by a selloff and LUV stock price declined steadily below the key EMAs and broke below the recent swing to decline to a three-year low.
Southwest Airlines company engages in the operation and management of passenger airlines. The company also offers other services for the ease of passengers.
Currently, the stock price is consolidating near the lows. The breakdown below the lower range might trigger a selloff and the price may decline to a major support of $25. Moreover, the breakout might bring some short-term optimistic opportunities and the price may try to recover.

LUV stock’s option-chain analysis states that the current implied volatility in the market of LUV is 43.06% with an increment of 1.48% in the last trading session. The at-the-money strike price has 1040 open contracts on the PUT side and 31 open contracts on the CALL side; indicating the dominance of buyers at the current level.
LUV Stock Price Forecast For 2023

The average analyst price target for LUV stock in 2023 is $32.14, which represents a potential upside of 21.28% from the current price. However, there is a wide range of analyst price targets from $20 to $50.
The most optimistic analysts believe that LUV stock could reach $50 in 2023 indicating an upside potential of over 88.68%. If the global airline industry grows strongly Southwest Airlines Company Company can manage itself successfully, a rise in stock price can be seen.
LUV Stock Price Showed Sharp Selling Below Key EMAs
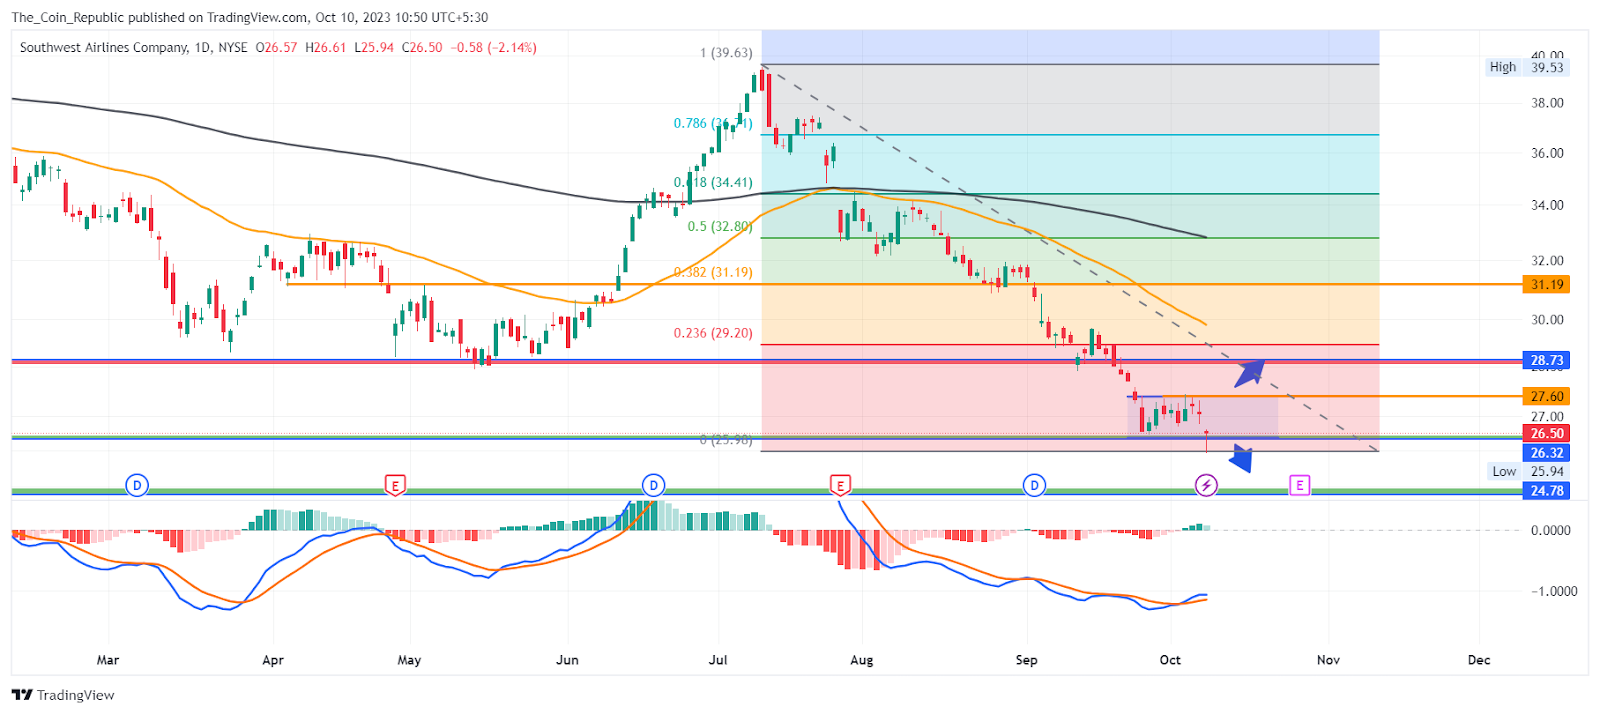
The overall technical indicators including the RSI and MACD signal a 90% “sell” with the strongest short-term outlook on maintaining the current direction.
Conclusion
LUV stock price witnessed an accumulation after it slipped near a three-year low price. The price trend analysis elaborates bearishness prevailing in the short term as well as the long term.
The last quarter showed a gain of over 29% after bottoming out. However, the current quarterly results triggered a gap-down opening below the key EMAs followed by a sharp selling that took the price to a three-year low. The breakdown may again trigger a selloff and the stock may decline more.
Technical Levels
- Support Levels: $26.32 and $24.78
- Resistance Levels: $27.60 and $28.73





