
 Home
Home News
News
- 1 Maker Crypto Trading above the key moving averages.
- 2 MKR Crypto halted near the value of $1600 exhibiting bearishness.
Maker price is down by 8.29% over the past 7 days, whereas according to the price action, the MKR price continues to move in the bear’s influence. Sellers are trying to pull Maker crypto prices toward the lower trendline.
Maker crypto must attract buyers in order to surge toward the upper trendline. Investors in Maker Crypto need to wait for any directional change over the daily time frame chart.
Maker price prediction showcases the decline of MKR crypto price from the higher level over the daily time frame chart. MKR crypto needs to attract buyers in order to reach the recovery level. However, trading volume has been below average and needs to grow for the Maker crypto price to sustain at a higher level.
Meanwhile, MKR crypto is trading above the 20, 50, 100, and 200-day daily moving averages. Maker Crypto’s performance has been remarkable throughout the year. MRK price has gained 19.46% in a month and 48.23% in the last three months.
Moreover, the MKR price has gained around 86.76% in the last six months and has gained 166.52% year to date. This confirms the facts regarding MKR crypto’s bullishness in the long term.
Technical Analysis of Maker Crypto Price in 1-D Timeframe
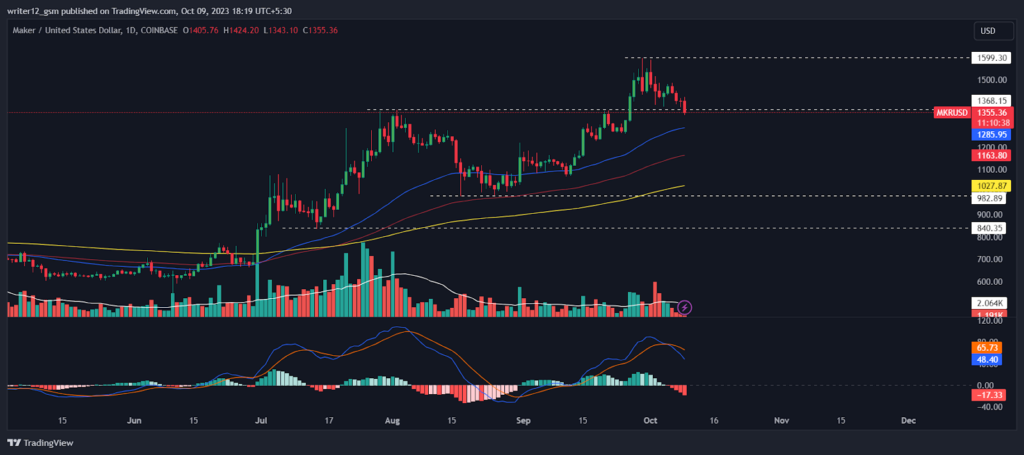
If it can keep this level, the Maker price could continue to go up and reach the first and second targets of $1500 and $1600. However, if the MKR price cannot maintain this level and falls, then it might hit the closest support levels of $1285 and $1163.
At the time of publishing, Maker crypto (USD: MKR) is trading above the 50 and 200-day SMAs (Simple moving averages), which are supporting the price trend.
However, if more selling volume adds up then the price might conquer supporting SMA’s by making lower highs and lows. Hence, the MKR price is expected to move downwards giving bearish views over the daily time frame chart.
Technical indicators suggest the downtrend momentum of the MKR crypto price. The relative strength index showcases the downtrend momentum of Maker crypto. RSI was at 49.40 and is heading towards the neutral to be oversold.
MACD exhibits the downside trend of MKR crypto price. The MACD line is below the signal line after a negative crossover. Investors in MKR crypto need to wait for any directional change over the daily time frame chart.
Summary
Maker Crypto price took the reversal from the high of $1599 and showcased bearishness on the daily chart. MKR key indicators RSI and MACD are indicating bearishness in the trend. However, the long-term trend is positive and probably it will rebound soon by taking support from the key EMAs.
Technical Levels
Support Levels: $1285 and $1163.
Resistance Levels: $1500 and $1600.
Disclaimer
This article is for informational purposes only and provides no financial, investment, or other advice. The author or any people mentioned in this article are not responsible for any financial loss that may occur from investing in or trading. Please do your own research before making any financial decisions
Mr. Pratik chadhokar is an Indian Forex, Cryptocurrencies and Financial Market Advisor and analyst with a background in IT and Financial market Strategist. He specialises in market strategies and technical analysis and has spent over a year as a financial markets contributor and observer. He possesses strong technical analytical skills and is well known for his entertaining and informative analysis of the Financial markets.


