
 Home
Home News
News
- 1 NNDM stock price trades above the major 20 and 50-day daily moving averages.
- 2 Nano Dimension Ltd. (NASDAQ: NNDM) stock’s 52-week price range is between $2 – $4.
Nano Dimension Ltd. is a company that makes smart machines for creating additively manufactured electronics. Its products include DragonFly IV, AME Materials, Fabrica 2.0, Fabrica Micro-AM Materials, Essemtec SMT Equipment, and Global Inkjet System. The company was founded in 2012 by Amit Dror and Simon Anthony-Fried and is based in Ness Ziona, Israel.
NNDM stock’s latest quarterly balance sheet for the period ending June 2023 reported total assets of $1.19 Billion and total liabilities of $42.71 Million. The debt-to-assets ratio is at 3.58%.
The NNDM stock’s latest quarterly earnings report for the period ending June 2023 displayed a revenue of $14.57 Million, with a net income of $9.02 Million and a profit margin from the last quarter of -61.88%.
The NNDM cash flow report for the period ending June 2023 shows how Nano Dimension Ltd. managed its cash flows from different sources and uses. The report reveals that the NNDM had a negative operating cash flow of $13.81 Million, showing that it spent more money than it earned from its core business activities.
However, Nano Dimension had a positive investing cash flow of $323.82 Million, meaning that it received more money than it spent on its long-term investments, such as acquisitions, equipment, or research and development.
Conversely, NNDM also had a negative financing cash flow of -$1.54 Million, highlighting that NNDM paid more money than it raised from its debt and equity financing, such as loans, dividends, or share buybacks.
Furthermore, NNDM stock price has changed in different ways in the past week, three months, six months, and one year, as shown by its chart. The NNDM stock price rose by 5.66% in the past week but went down by 10.54% in the past three months.
The NNDM stock price has also gone up by 11.55% in the past six months, and by 17.40% in the past year. Therefore, NNDM stock price has been volatile and has had both ups and downs in different time periods.
NNDM Stock Price Technical Analysis in 1-D Timeframe
The NNDM stock has a CMP of $2.80 and an intraday gain of 4.09%. The NNDM stock’s average volume for the last 10 days is 1.595 Million and its current volume is 1.842 Million. The NNDM stock has a float of 243.065 Million shares and a market cap of $654.275 Million.
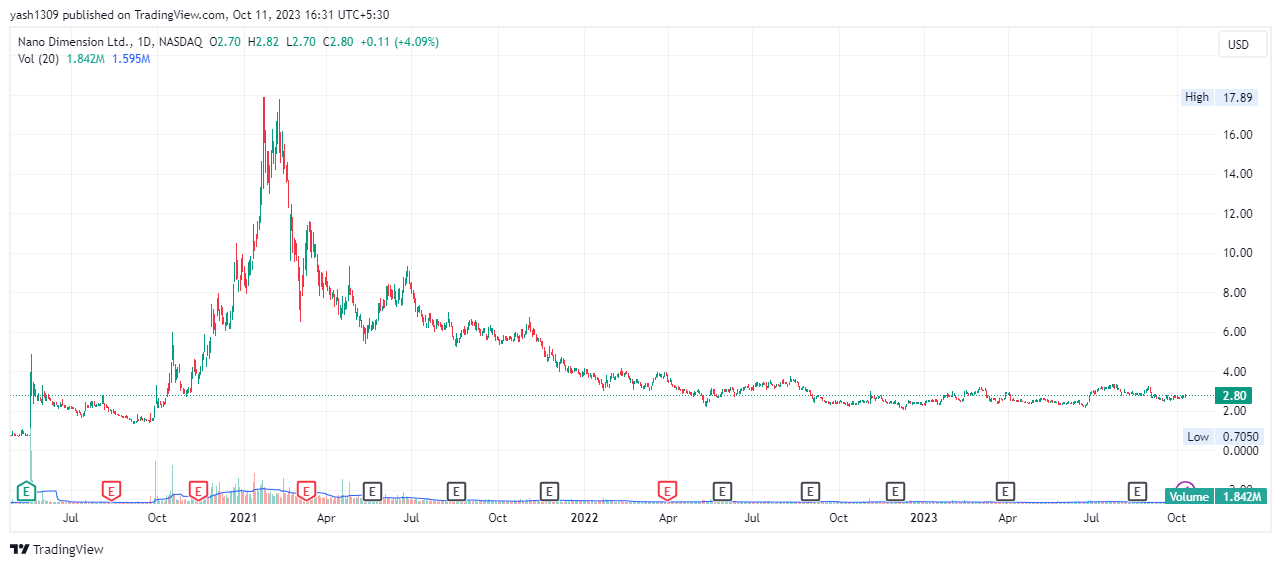
According to the price action displayed on the charts, NNDM stock price rose from the $1.5 support level in September 2020 and reached a high of $17 in January 2021, by making higher highs and lows in merely four months. However, it faced resistance and fell due to investors taking out their profit and dumping. The NNDM stock fell drastically by showing poor performance in the last three years. Year-to-date, it is observed that stock is trapped in a range of $2 – $3.
However, the stock showed recovery signs as the NNDM price took support at $2.5 around the last week of September 2023, the same level the stock surged back in 2020.
Therefore, if the Nano Dimension stock manages to gain strong buying momentum and surges above the swing high, it can trigger a rally. The probable resistance levels are between $3.5 and $4.
Alternatively, if the stock faces resistance again and continues to slip below, and breaks below $2.5, then it could fall up to $2.
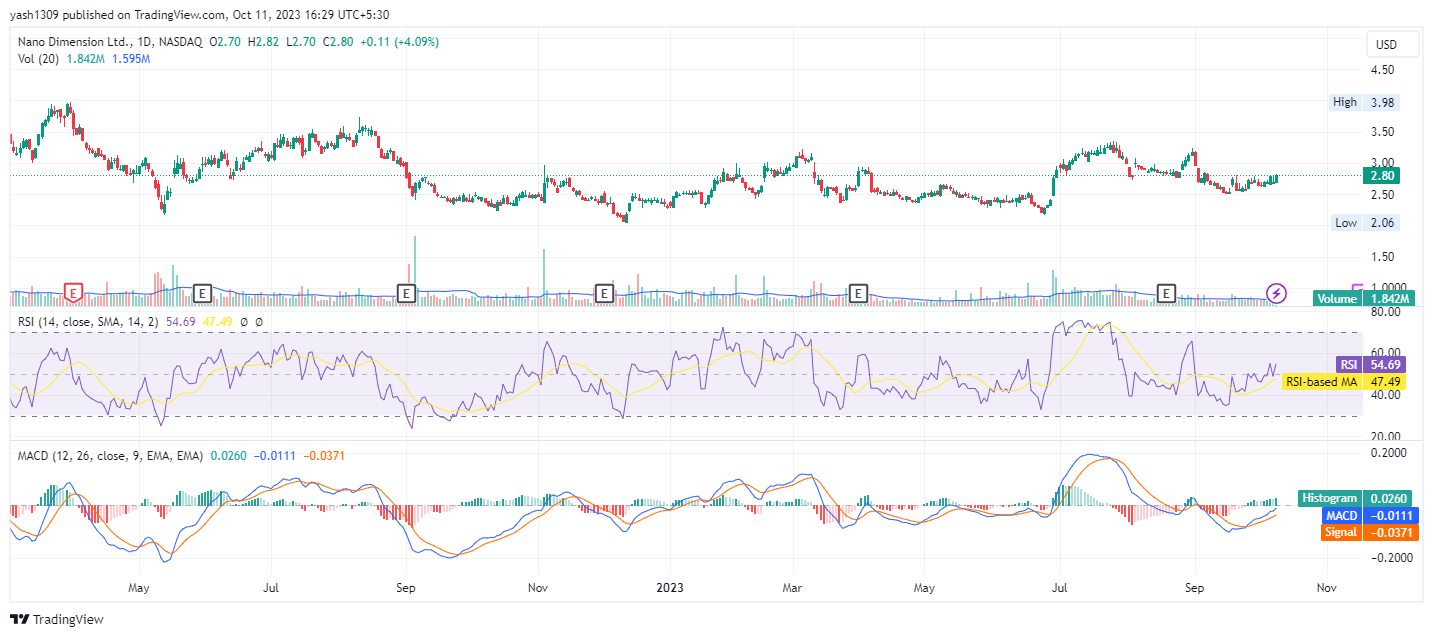
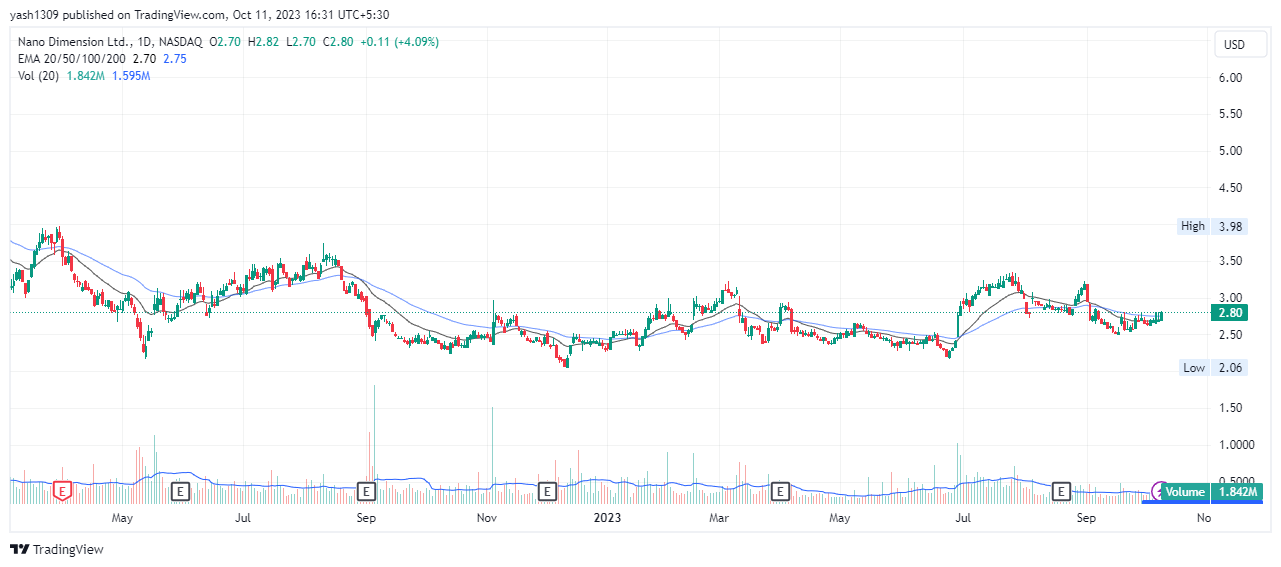
At the time of publishing, the price of Nano Dimension Ltd. (NASDAQ: NNDM) found recent support at $2.5 and jumped over 20 and 50 EMA’s. If more buying volume assists the price, NNDM might surpass major rejecting EMAs.
The MACD indicates a bullish cross. The RSI is at 54.69 and has bounced off the 14 SMA which is at 47.49. The indicators in the NNDM stock suggest positive signs on the charts.
Moreover, the stock ratings for NNDM stock are positive and highly recommended based on 8 analysts who have evaluated the stock in the last three months. The 1-year price forecasts for the stock by 5 analysts range between $11.00 to $20.00.
Summary
Nano Dimension Ltd. (NASDAQ: NNDM) chart indicates that the traders and investors of the share price are bullish and positive on the 1-D time frame. The price action shows a bullish outlook at the time of publishing. The technical analysis tools of the stock price highlight upward signals and support bullishness.
Technical Levels
Support Levels: $7 and $5
Resistance Levels: $10 and $14
Disclaimer
In this article, the views and opinions stated by the author, or any people named are for informational purposes only, and they don’t establish the investment, financial, or any other advice. Trading or investing in cryptocurrency assets comes with a risk of financial loss.

Andrew is a blockchain developer who developed his interest in cryptocurrencies while pursuing his post-graduation major in blockchain development. He is a keen observer of details and shares his passion for writing, along with coding. His backend knowledge about blockchain helps him give a unique perspective to his writing skills, and a reliable craft at explaining the concepts such as blockchain programming, languages and token minting. He also frequently shares technical details and performance indicators of ICOs and IDOs.


