
 Home
Home News
News

- 1 Zoom stock price (NASDAQ: ZM) fell 10% from the recent swing high.
- 2 ZM stock price struggles to break out of the 50-day and 200-day EMA.
- 3 Zoom stock price is in a short-term downtrend.
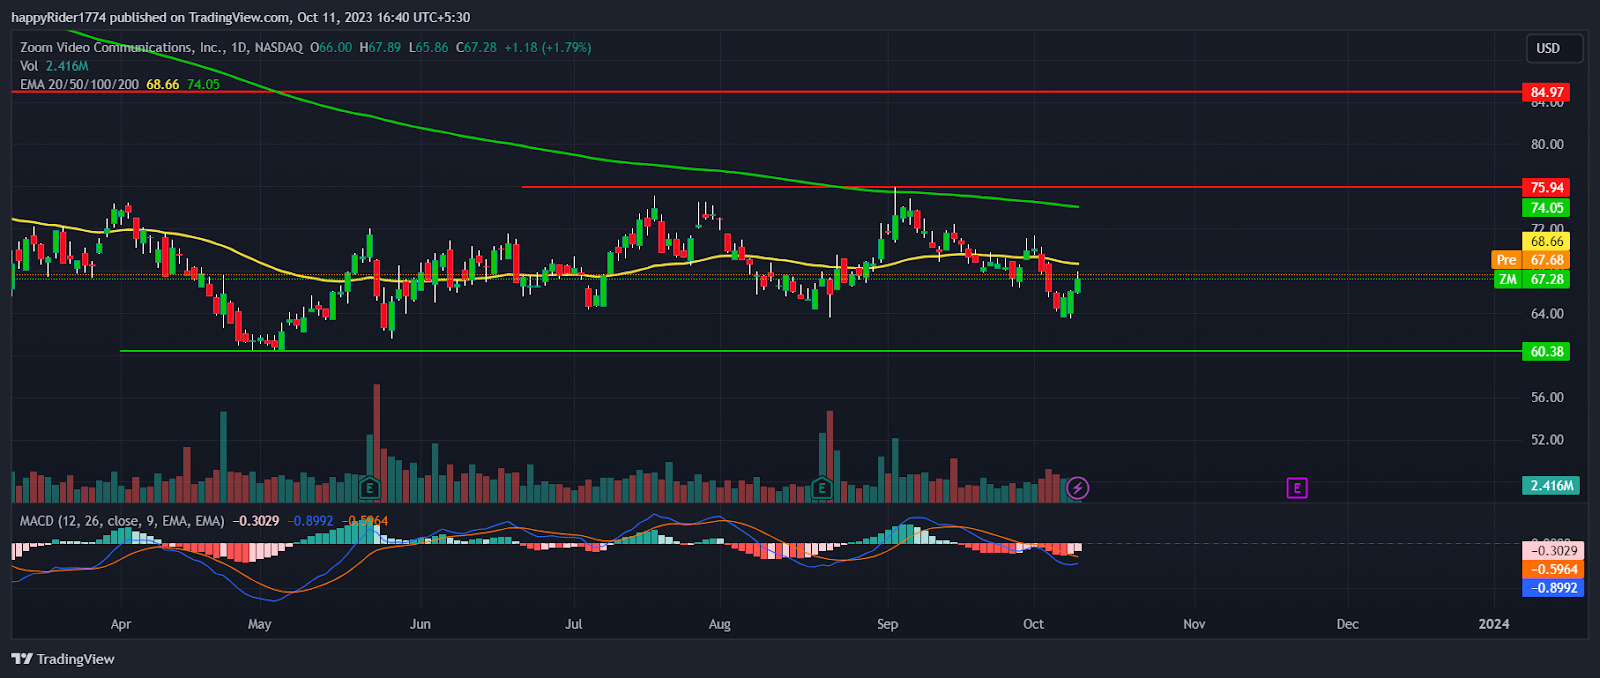
Zoom stock price (NASDAQ: ZM) faced rejection from $75.00 and fell approximately 10% in a short period of time.
ZM stock price trading below the 200-day and 50-day EMA showcases a downtrend. The stock is declining by forming lower low swings indicating that the sellers are active on higher levels.

Zoom stock price has not performed well in 2023 and traded in the wide range between $60.00 to $75.00. Buyers and sellers both tried multiple times to break either side of the range but failed and the price continued to trade in the range.
It seems that ZM stock price has formed a strong base near $60.00. So it will be difficult for sellers to pull the prices further down.
At present, the stock price is near to the lower range and buyers are trying their best to rebound from the lows. If they succeed then prices will rise and journey to $75.00.
However, if the ZM stock price faces rejection from the EMA, then $60.00 will be at risk. Zoom stock price closed the previous session at $67.28 with an intraday rise of 1.79%. The market capitalization stands at $20.25 Billion.
Will Zoom Stock Price Recover or Decline?
Zoom stock price (NASDAQ: ZM) is stuck in a range. The next direction of the stock will be visible when prices break either side of the range.
The price action tells us that ZM stock price is continuously facing rejection from the higher levels. So, it needs fresh buyers to push the price upward. Otherwise, bears will keep dominating.
Until ZM share price is able to break the $75.00 hurdle, the price will lack the positive momentum. The technical analysis, and short-term pullback in the ZM stock price may come in the coming months.
ZM Stock Price Formed Bullish Candle After 4 Weeks
ZM stock price formed a bullish candle on a weekly chart after falling for four consecutive weeks. If the broader market indices and the communication technology sector stocks recover in the coming months. Then it may positively affect the Zoom stock and recovery might continue.
The MACD curve slopes downward and the histogram bar is red indicating mild bearishness. Whereas, RSI at 46 pointing north denotes buyers are active and returning back to track.
Conclusion
Zoom stock price (NASDAQ: ZM) is in a correction phase and sellers are dominating on the higher levels. The analysis suggests that ZM stock price might show a short-term pullback but will face difficulty in breaking the higher range.
Technical Levels
- Resistance levels: $75.94 and $84.97
- Support levels: $64.00 and $60.38
Disclaimer
The views and opinions stated by the author, or any people named in this article, are for informational purposes only. They do not establish financial, investment, or other advice. Investing in or trading crypto assets comes with a risk of financial loss.

Adarsh Singh is a true connoisseur of Defi and Blockchain technologies, who left his job at a “Big 4” multinational finance firm to pursue crypto and NFT trading full-time. He has a strong background in finance, with MBA from a prestigious B-school. He delves deep into these innovative fields, unraveling their intricacies. Uncovering hidden gems, be it coins, tokens or NFTs, is his expertise. NFTs drive deep interest for him, and his creative analysis of NFTs opens up engaging narratives. He strives to bring decentralized digital assets accessible to the masses.


