
 Home
Home News
News
- 1 Palantir stock price started a recovery rally heading towards the higher levels.
- 2 PLTR stock price is showcasing bullishness on the daily time frame.
PLTR shows a strong chart structure in the recent trading sessions. The price is above the key moving averages and reflects the bull’s power. The bears were wary of the competition and waited for a decline to show their influence. But seeing the rise, they were closing their positions and staying on the sidelines. The buyers kept making long positions and steadily moved toward $20.
Palantir stock was trading at $17.92 at the time of writing with a slight increase of 0.67% for the day, showing neutrality in the last trading session.

The trading volume for the day was 55.746 Million. The market cap of Palantir stock was $38.516 Billion. The stock displayed the bulls’ strength and maintained the gains leading the way.
On the daily charts, PLTR stock stayed on the top, near the supply zone, holding the gains convincingly. Buyers have an edge and have dominated the past few trading sessions. Moreover, the price persisted in forming higher highs, and sellers were trapped during the rebound.
Technical Analysis of PLTR Stock Price in 1-D Time Frame
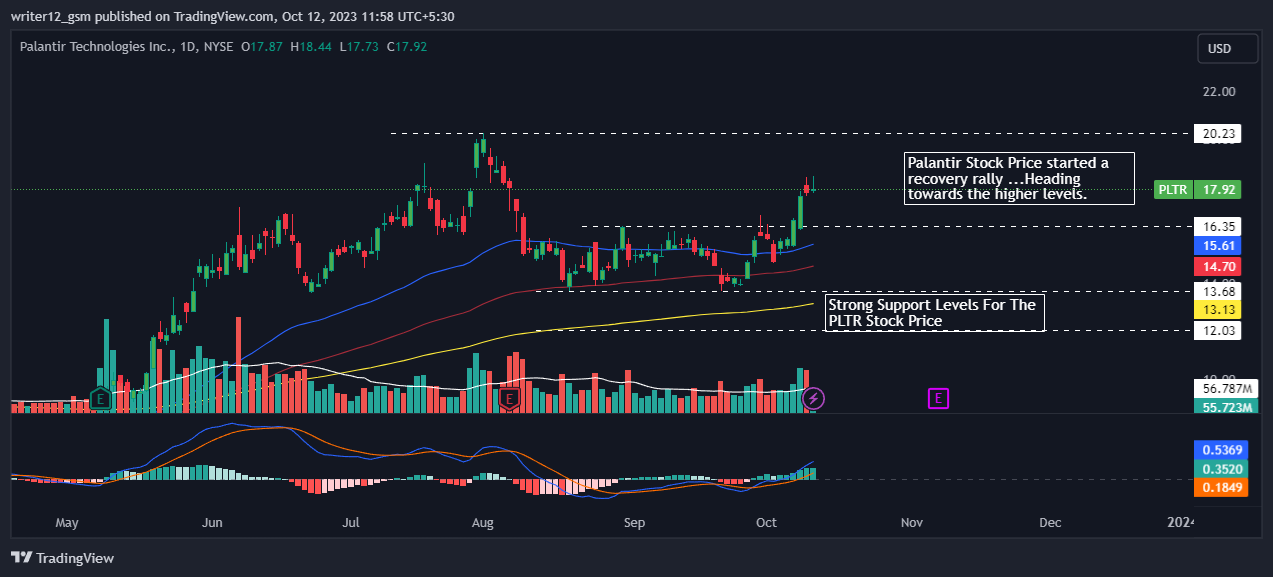
Currently, PLTR stock is trading above the 50 and 200-day exponential moving averages, which are supporting the price momentum.
Nevertheless, if buying volume adds up, then the price might support bullish momentum by making higher highs and new highs. Hence, the PLTR price is expected to move upward giving a bullish outlook over the daily time frame chart.
The current value of RSI is 67.34 points. The 14 SMA is above the median line at 53.55 points which indicates that the PLTR stock is bullish.
The MACD line at 0.5369 and the signal line at 0.1849 are above the zero line. A bullish crossover is observed in the MACD indicator which signals strength in the momentum of the Palantir stock price.
Weekly Charts Price Analysis of PLTR Stock
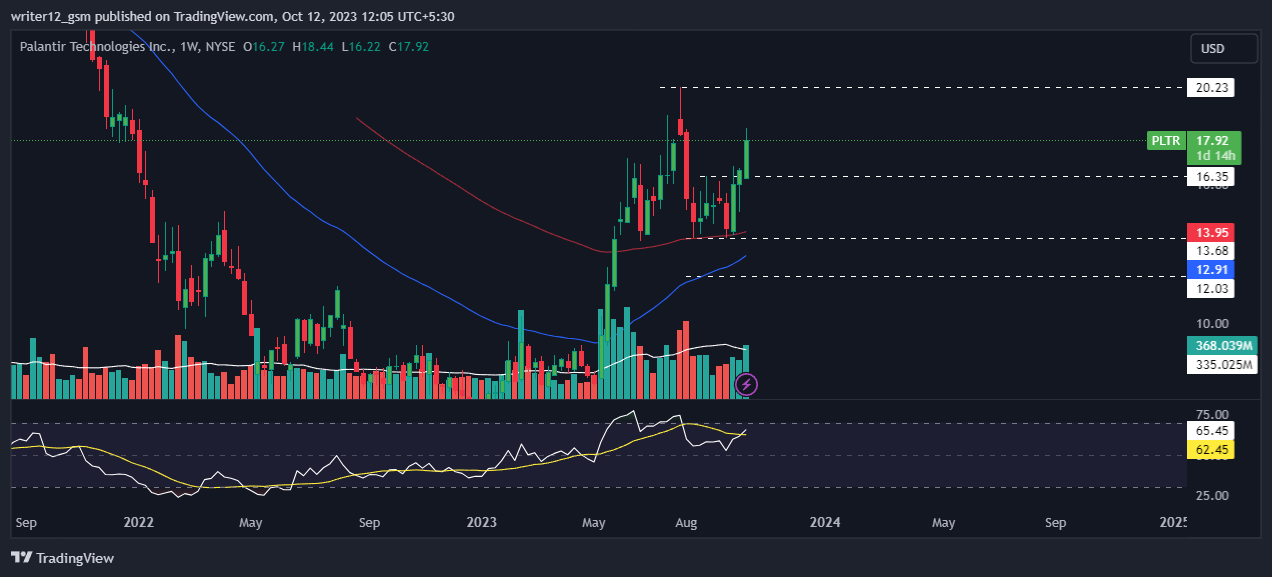
The weekly chart of PLTR stock reveals that the buyers have been dominant. The stock has been heading towards an upward trend, as it broke below the key EMAs.
Technical indicators confirm the bullish sentiment, as the RSI is near the overbought zone at 65 and the MACD has also indicated bullishness. These signals indicate that the stock may reach the upper levels in the coming weeks.
Conclusion
PLTR stock price is trading in a bullish momentum trading above the key moving averages. However, currently, the $20 mark is a crucial point as beyond $20 the Palantir stock is bullish and it could also act as a resistance for the stock. Key indicators like MACD, RSI, and EMAs are giving bullish signals.
Technical Levels
Support Levels: $13.68 and $12.03.
Resistance Levels: $16.35 and $20.23.
Disclaimer
The analysis provided in this article is for informational and educational purposes only. Do not rely on this information as financial, investment, or trading advice. Investing and trading in stock involves risk. Please assess your situation and risk tolerance before making any investment decisions.

Adarsh Singh is a true connoisseur of Defi and Blockchain technologies, who left his job at a “Big 4” multinational finance firm to pursue crypto and NFT trading full-time. He has a strong background in finance, with MBA from a prestigious B-school. He delves deep into these innovative fields, unraveling their intricacies. Uncovering hidden gems, be it coins, tokens or NFTs, is his expertise. NFTs drive deep interest for him, and his creative analysis of NFTs opens up engaging narratives. He strives to bring decentralized digital assets accessible to the masses.


