
 Home
Home News
News

- 1 BLK stock price decreased by 1.16% over the past seven days.
- 2 BlackRock stock price is below the key moving averages, showcasing bearishness.
BlackRock stock price is facing strong bearish pressure on the daily technical charts, as it is trading below the 100 and 200-day EMAs. The stock has failed to break above its key resistance levels near the EMAs in the past few months, despite several attempts by the buyers.
The stock is currently trading near $627.66, with a marginal loss of 1.34% in the intraday session. The stock has a potential upside target of $700, but it needs to overcome the bearish momentum and surge above the 200-day EMA. The stock has a support level of $620, which could prevent further downside.

BlackRock price prediction suggests that the stock is in the firm grip of the bears and needs to show some signs of reversal before confirming a bullish trend.
Technical indicators favor the bears projecting a pessimistic perspective for the buyers. RSI and stochastic RSI oscillator are moving near the overbought zone whereas the major EMA lines are acting as barrier points for BLK stock price.
The company’s performance has been dismal throughout the year. It reported returns of -12.83% in the year-to-date period, -7.73% in the last six months, -10.19% in the last month, and -1.16% in the last week. This shows a persistent bearish trend that has not reversed yet.
Technical Analysis of BlackRock Stock Price in 1-D Time Frame
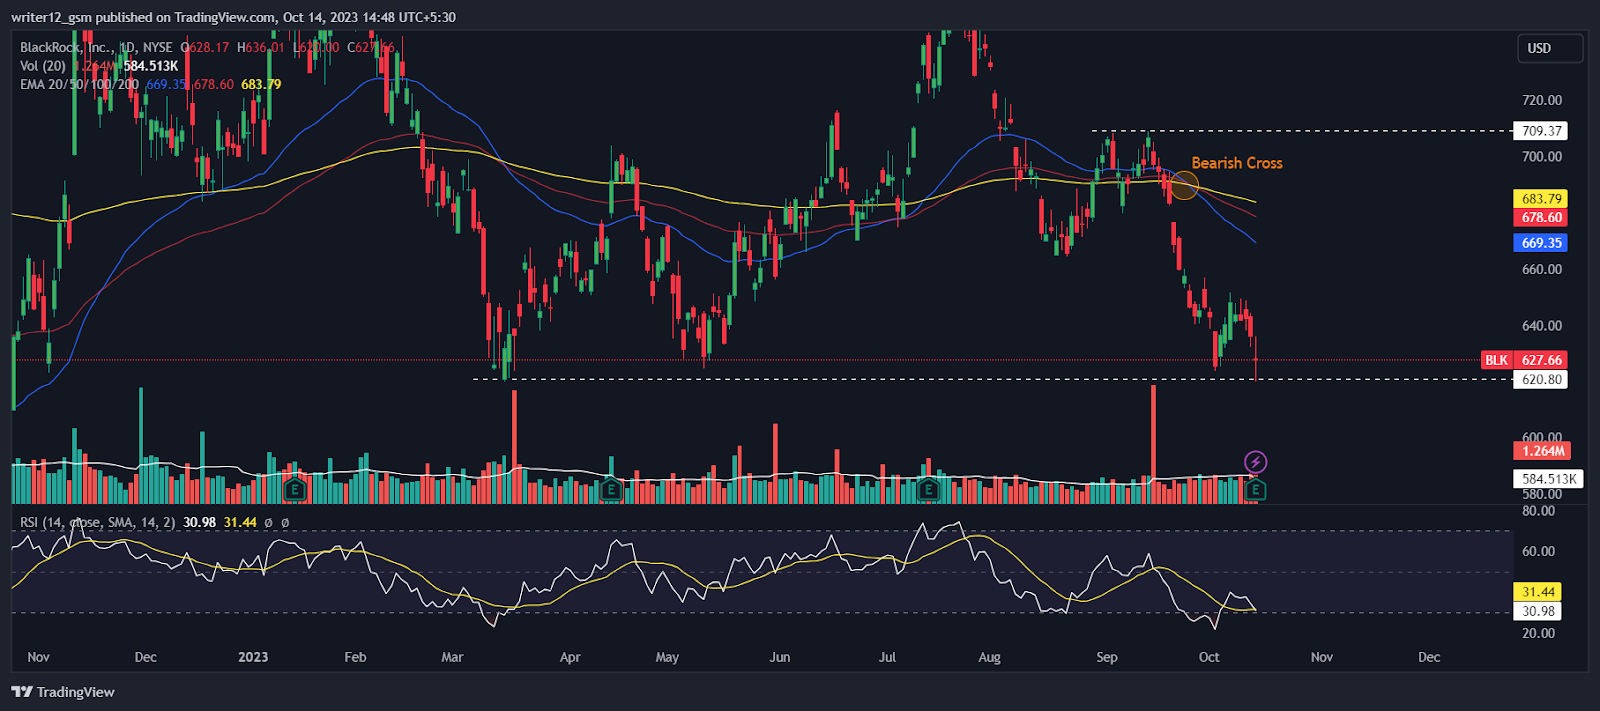
BlackRock stock (NYSE: BLK) is trading under the 50 and 200-day daily moving averages (DMAs), which are not upholding the price trend.
The current value of RSI is 30.98 points. The 14 SMA is above the median line at 31.44 points which indicates that the BlackRock stock is bearish.
The MACD line at -13.18 and the signal line at -12.92 are below the zero line. A bearish crossover is observed in the MACD indicator which signals more bearishness for the BLK stock price.
Weekly-Time Horizon Analysis: BLK Stock
The weekly charts of BlackRock stock price reveal that the sellers have been dominant. The stock has been on a downtrend, as it has broken below the key EMAs. Technical indicators confirm the bearish sentiment, as the RSI is near the oversold zone at 38 and the MACD shows red bars and a bearish crossover. These signals indicate that the stock may face more downside pressure in the coming weeks.
Summary
BlackRock stock (NYSE: BLK) technical oscillators also support the bearish trend. The MACD, RSI, and EMAs are emphasizing negative signs and imply that the downtrend may continue in the BLK stock price. BlackRock price action suggests that the investors and traders are bearish on the 1-day time frame. The price action reflects a bearish perspective at the moment.
Technical Levels
Support Levels: $620 and $600
Resistance Levels: $669 and $678
Disclaimer
This article is for informational purposes only and does not provide any financial, investment, or other advice. The author or any people mentioned in this article are not responsible for any financial loss that may occur from investing in or trading. Please do your own research before making any financial decisions.

Nancy J. Allen is a crypto enthusiast, with a major in macroeconomics and minor in business statistics. She believes that cryptocurrencies inspire people to be their own banks, and step aside from traditional monetary exchange systems. She is also intrigued by blockchain technology and its functioning. She frequently researches, and posts content on the top altcoins, their theoretical working principles and technical price predictions.


