
 Home
Home News
News

- 1 ED stock price slid 0.70% intraday on Wednesday and closed at $88.28.
- 2 Consolidated Edison Inc. is yet to announce quarterly results on Thursday, 2nd November which may affect the price trend.
- 3 ED stock price witnesses the formation of a bullish flag over the daily chart.
Consolidated Edison Inc. (NYSE: ED) stock price hovers near the 50-day EMA after surging from the lower boundary of the bullish flag pattern. The stock price has shown gains in recent sessions after taking a rebound from the $80 level.
The trend analysis in the long-term exhibits a sideways trend for the last five quarters. The stock has been hovering in a 20% range with resistance at $100 and support at $80. The breakout above the $100 level may turn the stock price bullish in the long term.

Consolidated Edison Inc. is yet to announce quarterly results on 2nd November which might bring volatility in the stock price. The Wall Street analysts are hoping the company will deliver an estimated revenue of $3.89 Billion and earnings of $1.636 Billion.
Analysts offering a 1-year price forecast for Consolidated Edison have a maximum estimate of $103 with an upside potential of 16.67% and a minimum estimate of $73 with a downside potential of 17.31%.
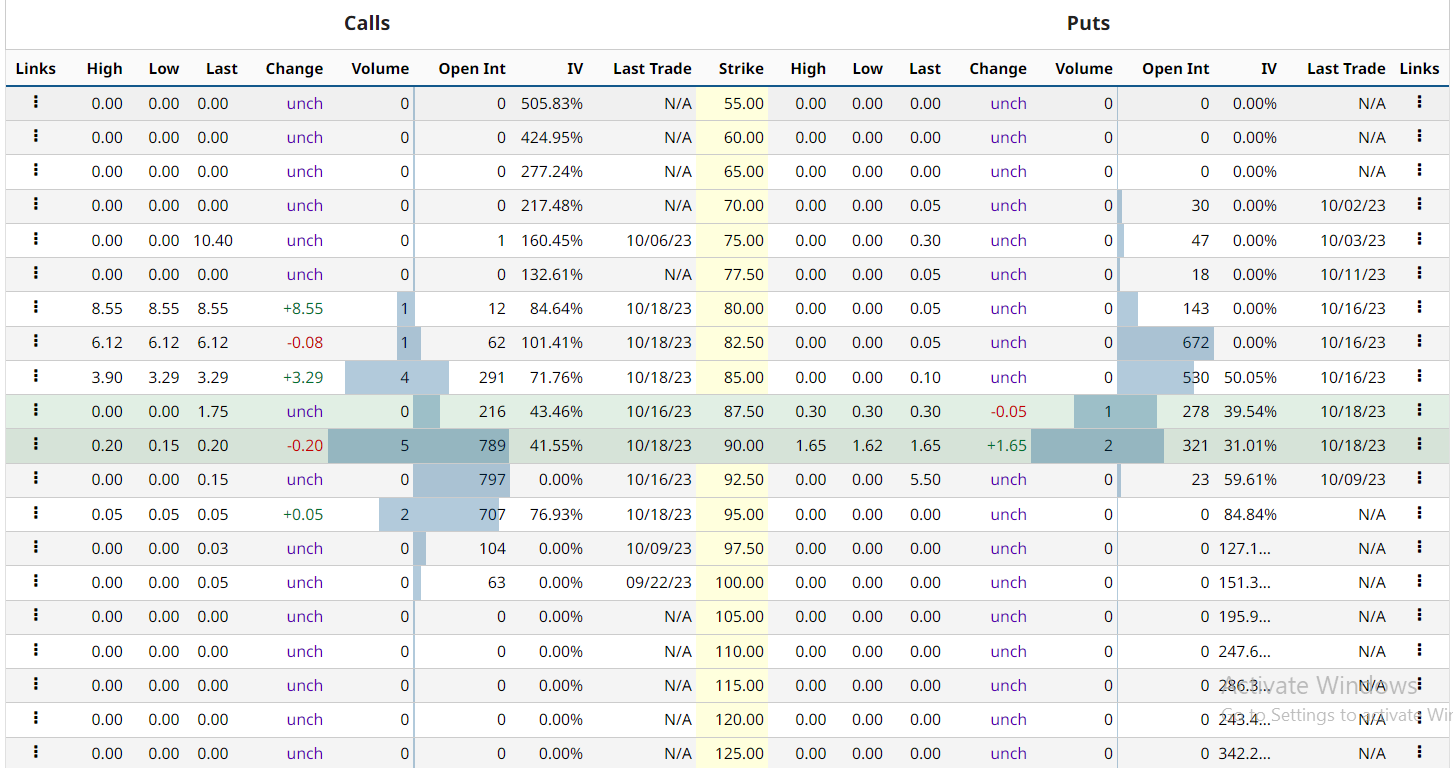
ED stock option-chain analysis states that the current implied volatility in the market is 25.59% with an increment of 2.58% in the last trading session. The at-the-money strike has an OI of 278 on the PUT side and 216 on the CALL side indicating none of the buyers and sellers dominating the CMP.
ED Stock Price Daily Chart Shows Formation of Bullish Flag
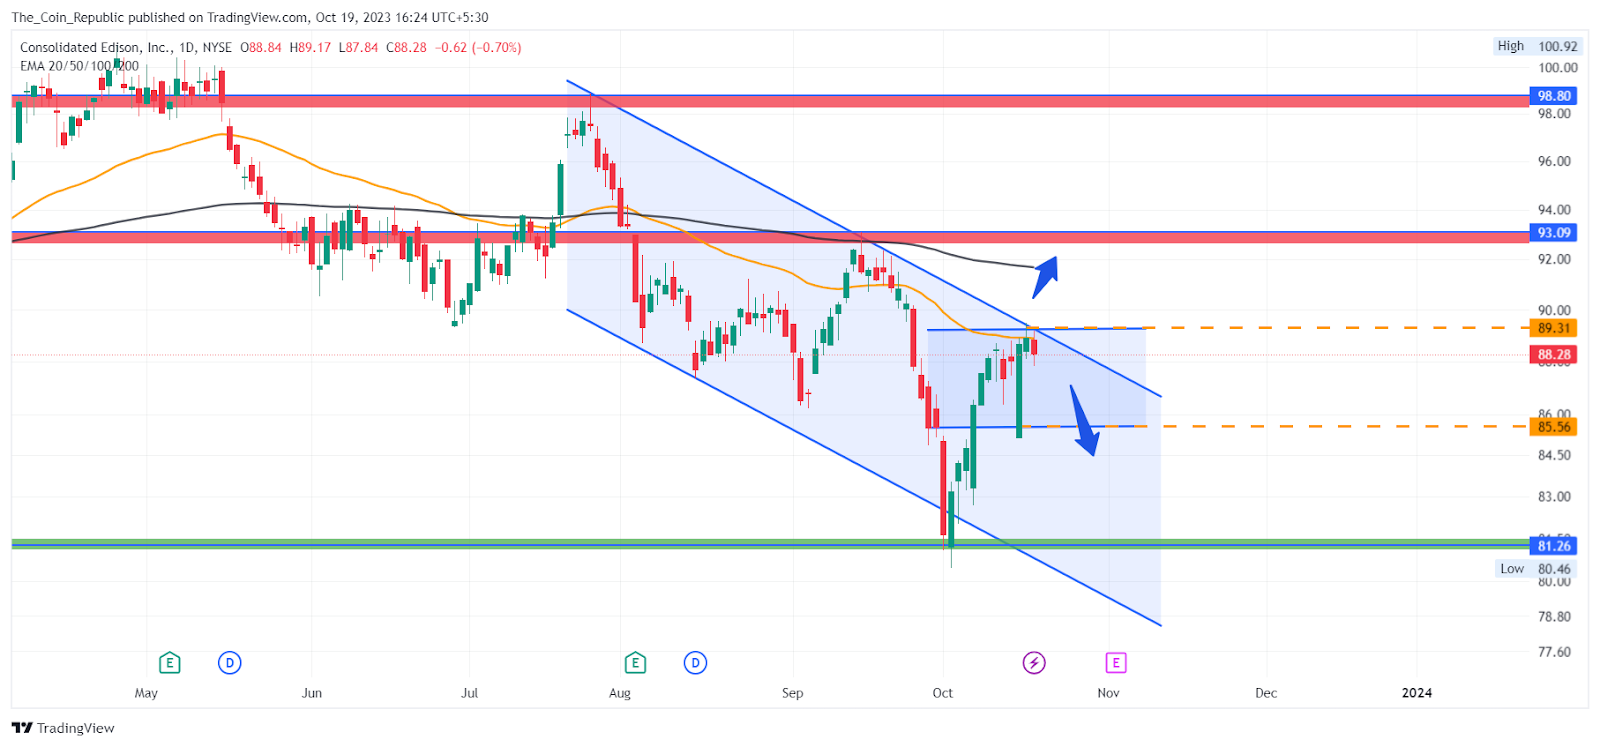
The ED stock price currently trades at $88.28 and has bounced back from the lower demand zone. However, the price still trades in the bullish flag channel pattern indicating bearish dominance. The price may show a decline in the short term until it is maintained in the range.
The breakout of the pattern may turn the short-term trend bullish and the price may surge higher.
EMAs Show Bulls Regaining in the Short-Term
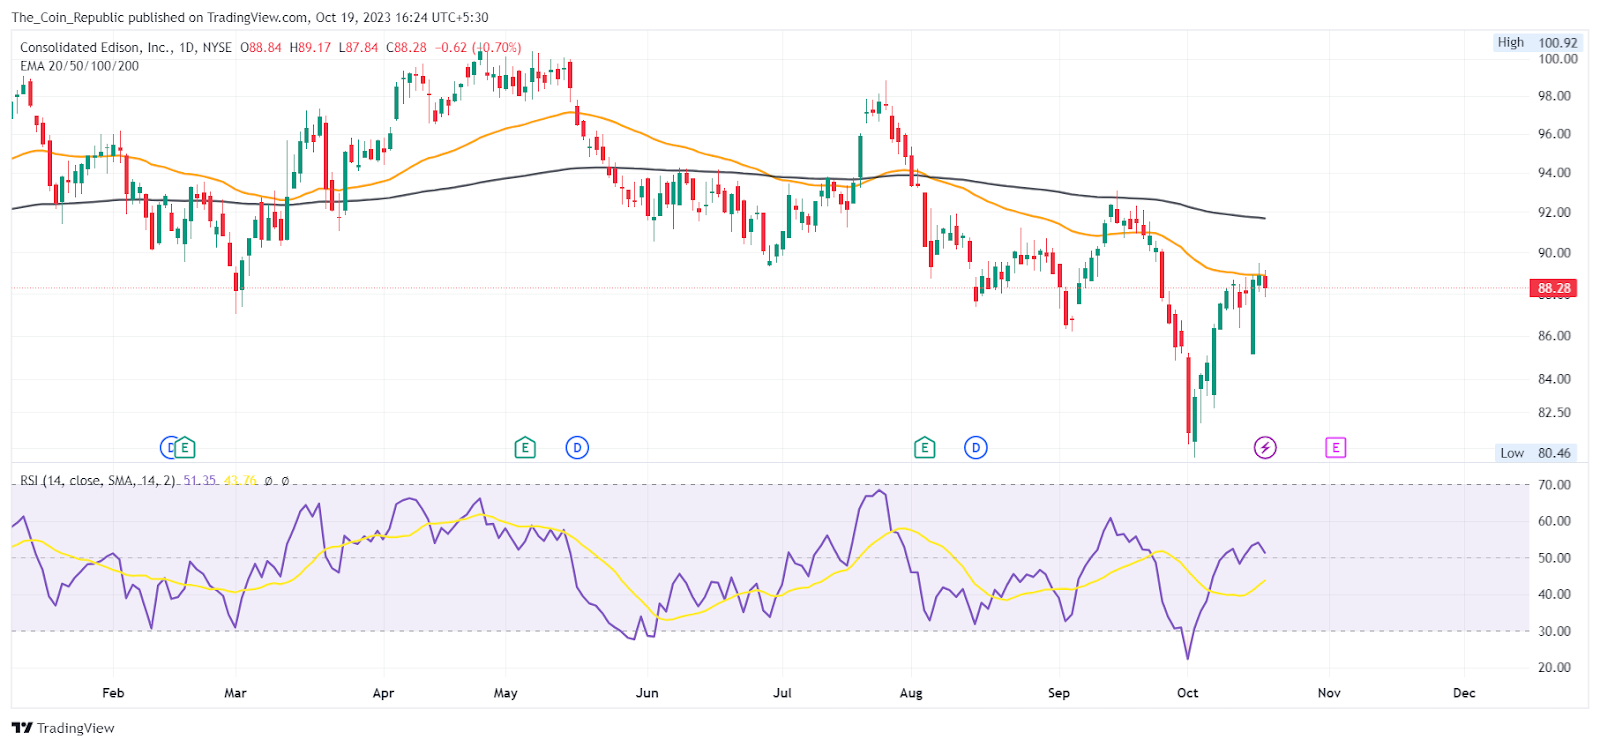
The daily ED stock price chart shows that the price slipped below 50-day and 200-day indicating weakness in the short term.
The overall technical opinion rating including RSI and MACD is signaling an 88% “sell” with the strongest short-term outlook on maintaining the current direction.
Conclusion
Consolidated Edison Inc. stock price is near the 50-day EMA and has bounced back from $80. The long-term trend is sideways between $80 and $100. The earnings report on November 2nd could affect the price.
The analysts have different estimates for the price in the next year from $73 to $103. The price is at $88.28 and is in a bearish flag pattern. The price may fall in the short term until it breaks out of the pattern. The breakout could signal a bullish trend.
Technical Levels
- Support levels: $85.56 and $81.11
- Resistance levels: $89.31 and $93.09
Disclaimer
The views and opinions stated by the author, or any people named in this article, are for informational purposes only and do not establish financial, investment, or other advice. Investing in or trading crypto or stock comes with a risk of financial loss.

Adarsh Singh is a true connoisseur of Defi and Blockchain technologies, who left his job at a “Big 4” multinational finance firm to pursue crypto and NFT trading full-time. He has a strong background in finance, with MBA from a prestigious B-school. He delves deep into these innovative fields, unraveling their intricacies. Uncovering hidden gems, be it coins, tokens or NFTs, is his expertise. NFTs drive deep interest for him, and his creative analysis of NFTs opens up engaging narratives. He strives to bring decentralized digital assets accessible to the masses.


