
 Home
Home News
News

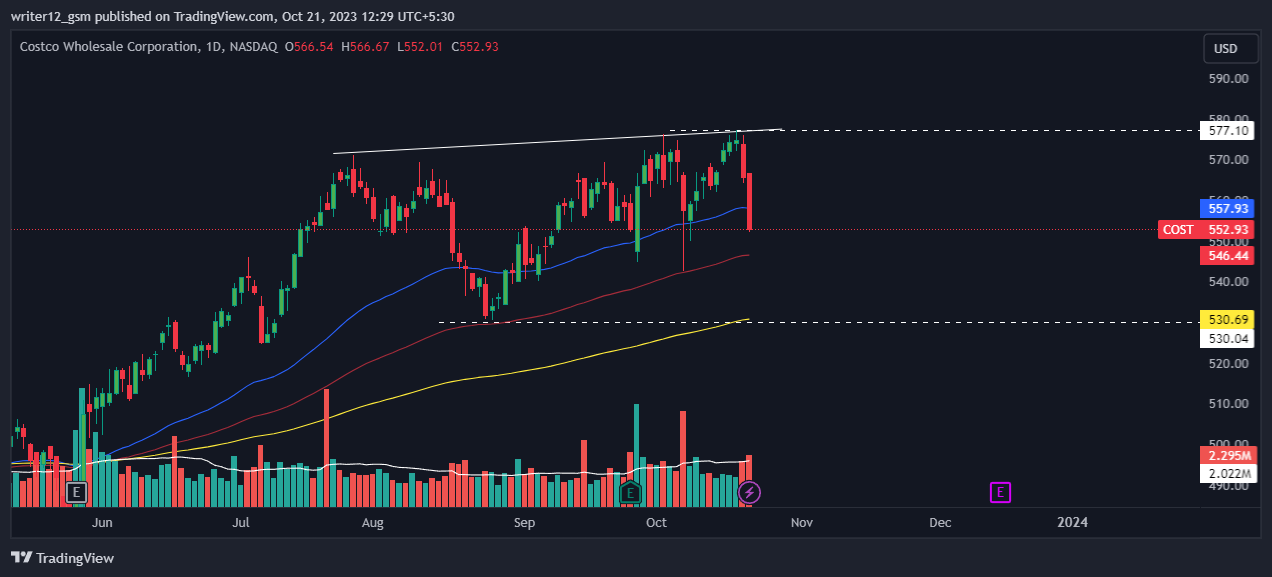
- 1 COST stock price broke below the key moving averages, showcasing bearishness on the daily charts.
- 2 Costco stock price is facing corrective moves on the daily time frame.
Costco stock price failed to sustain the high of $577.10 and reversed its direction, resuming the downtrend that indicates further weakness in the market. The market is trading below the dynamic support trendline, which could lead to more downtrend.
Costco stock price has been falling from its peak levels and is heading toward the lower levels. It is in a bearish trend after breaking below the 20-day and 50-day moving averages. The bearish pressure could push COST stock to lower levels soon and extend the downtrend.

The current situation requires traders and investors to be patient and wait for a clear signal of a break above or below the range before making any moves. They should also avoid FOMO and minimize losses.
Costco stock price fell 1.94% last week; it declined by 2.02% through the month. Furthermore, COST shares experienced an 8.55% rise within the past six months and an increase of 17.39% over the past year.
Additionally, the COST stock price slipped by approximately 20.73% year to date. These trends collectively highlight the challenges faced by Costco stock in their recovery efforts throughout the year.
Technical Analysis of Costco Stock Price
At the moment, Costco stock (NASDAQ: COST) is below the 20 and 50-day exponential moving averages (EMAs), which do not support the price trend. If bulls want to make a comeback, they will have to rise and sustain the price above the 20-day EMA. However, the sellers seem to be more aggressive.
The current value of RSI is 42.22 points. The 14 SMA is above the median line at 54.47 points which indicates that the Costco stock is bearish.
The MACD line at 3.27 and the signal line at 2.21 are above the zero line. A bearish crossover is observed in the MACD indicator which signals more bearishness for the COST stock price.
There is a strong buy opinion among 38 analysts who follow Costco stock. More than half of them 21 rate Costco as a ‘Strong Buy,’ while 4 give it a ‘Buy’ rating. 11 of the analysts recommend holding the stock, and 2 of them advise selling it.
Costco stock has an average price target of $597.15, which implies a potential increase of 8.00% from its current price of $552.93. The price targets vary from a high of $680 to a low of $502.00.
Summary
COST stock price prediction suggests the chart is mildly bearish. The sellers are dominating on the higher levels. Costco (NASDAQ: COST) technical oscillators support the bearish trend. The MACD, RSI, and EMAs are emphasizing negative signs and imply that the downtrend may continue in the COST stock price. Costco price action suggests that the investors and traders are bearish on the 1-day time frame. The technical analysis suggests that the Costco stock price is in a bearish grip and the probability of testing the previous highs in the coming months remains low.
Technical Levels
Support Levels: $546.44 and $530.69.
Resistance Levels: $557.93 and $577.10.
Disclaimer
This article is for informational purposes only and does not provide any financial, investment, or other advice. The author or any people mentioned in this article are not responsible for any financial loss that may occur from investing in or trading. Please do your own research before making any financial decisions
Mr. Pratik chadhokar is an Indian Forex, Cryptocurrencies and Financial Market Advisor and analyst with a background in IT and Financial market Strategist. He specialises in market strategies and technical analysis and has spent over a year as a financial markets contributor and observer. He possesses strong technical analytical skills and is well known for his entertaining and informative analysis of the Financial markets.


