
 Home
Home News
News
- 1 Mullen stock price is below the 50, 100, and 200-day moving averages.
- 2 MULN stock price is in the bears’ hands, showcasing bearishness on the daily chart.
Mullen stock price is facing strong bearish pressure on the daily technical charts, as it is trading below the 100 and 200-day EMAs. The stock failed to break above its key resistance levels near the EMAs in the past few months, despite several attempts by the buyers.
The stock is currently trading near $0.2450, with a marginal loss of -8.48% intraday. The stock has a potential upside target of $1, but it needs to overcome the bearish momentum and surge above the 50-day EMA. The stock has a support level of $0.2000, which could prevent further downside.

Mullen price prediction suggests that the stock is in the firm grip of the bears and needs to show signs of reversal before a bullish trend can be confirmed.
The technical indicators favor the bears projecting a pessimistic perspective for the buyers. RSI and stochastic RSI oscillator are moving near the overbought zone whereas the major EMA lines are acting as barrier points for MULN stock price.
The company’s performance has been dismal throughout the year. It has suffered negative returns of 99.66% in the year-to-date period, 98.99% in the last six months, 58.75% last month, and 41.03% last week. This shows a persistent bearish trend that has not reversed yet.
Technical Analysis of Mullen Stock Price in 1-D Time Frame
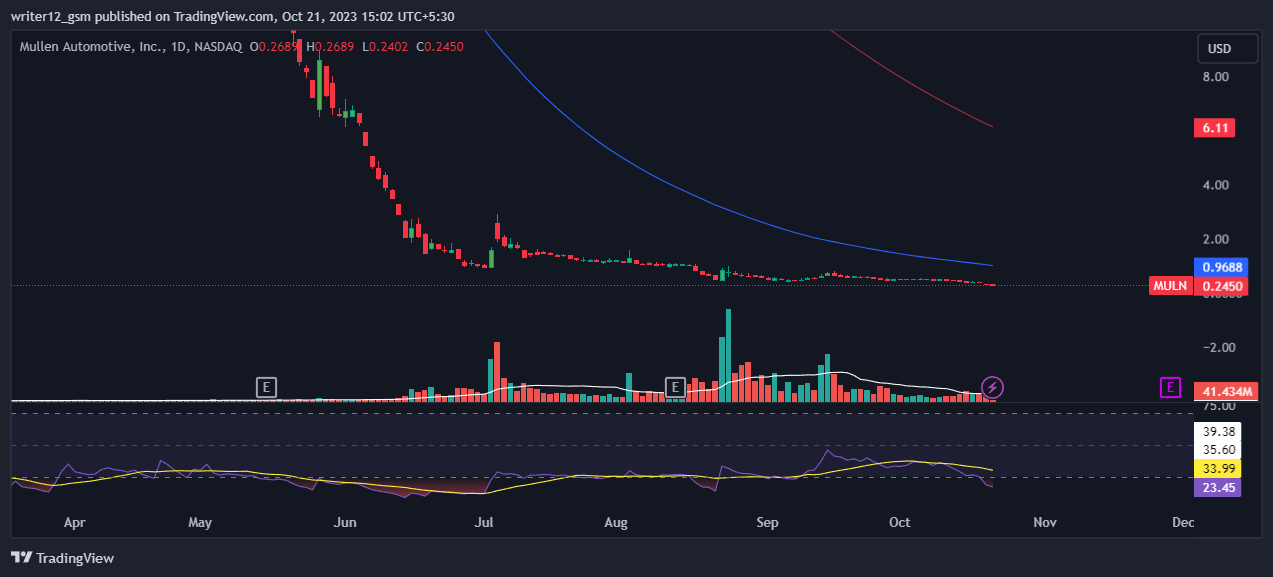
Mullen stock (NASDAQ: MULN) is under the 50 and 200-day daily moving averages (DMAs), which are not upholding the price trend. The current value of the RSI is 23.45 points. The 14 SMA is below the median line at 33.99 points which indicates that the Mullen stock is bearish.
The MACD line at -0.0845 and the signal line at -0.0768 are below the zero line. A bearish crossover is observed in the MACD indicator which signals more bearishness for the MULN stock price.
Weekly-Time Horizon Analysis
The weekly charts of Mullen stock reveal that the sellers have been dominant. The stock has been on a downward trend, as it broke below key EMAs. Technical indicators also confirm the bearish sentiment, as the RSI is near the oversold zone at 29 and the MACD shows red bars and a bearish crossover. These signals indicate that the stock may face more downward pressure in the coming weeks.
Summary
Mullen (NASDAQ: MULN) technical oscillators support the bearish trend. The MACD, RSI, and EMAs are emphasizing negative signs and imply that the downtrend may continue in the MULN stock price. Mullen price action suggests that the investors and traders are bearish on the 1-day time frame. The price action reflects a bearish perspective at the moment.
Technical Levels
Support Levels: $0.2400 and $0.2000
Resistance Levels: $0.5000 and $0.9688
Disclaimer
This article is for informational purposes only and does not provide any financial, investment, or other advice. The author or any people mentioned in this article are not responsible for any financial loss that may occur from investing in or trading. Please do your own research before making any financial decisions.
Steve Anderson is an Australian crypto enthusiast. He is a specialist in management and trading for over 5 years. Steve has worked as a crypto trader, he loves learning about decentralisation, understanding the true potential of the blockchain.


