
 Home
Home News
News
- 1 VeChain price prediction shows the surge of VET crypto inside a bullish flag pattern which signifies a potential breakout.
- 2 VET crypto recovered above 20 and 50-EMAs to reach the 100 and 200-days daily moving averages.
- 3 VeChain cryptocurrency gained around 6.68% year to date.
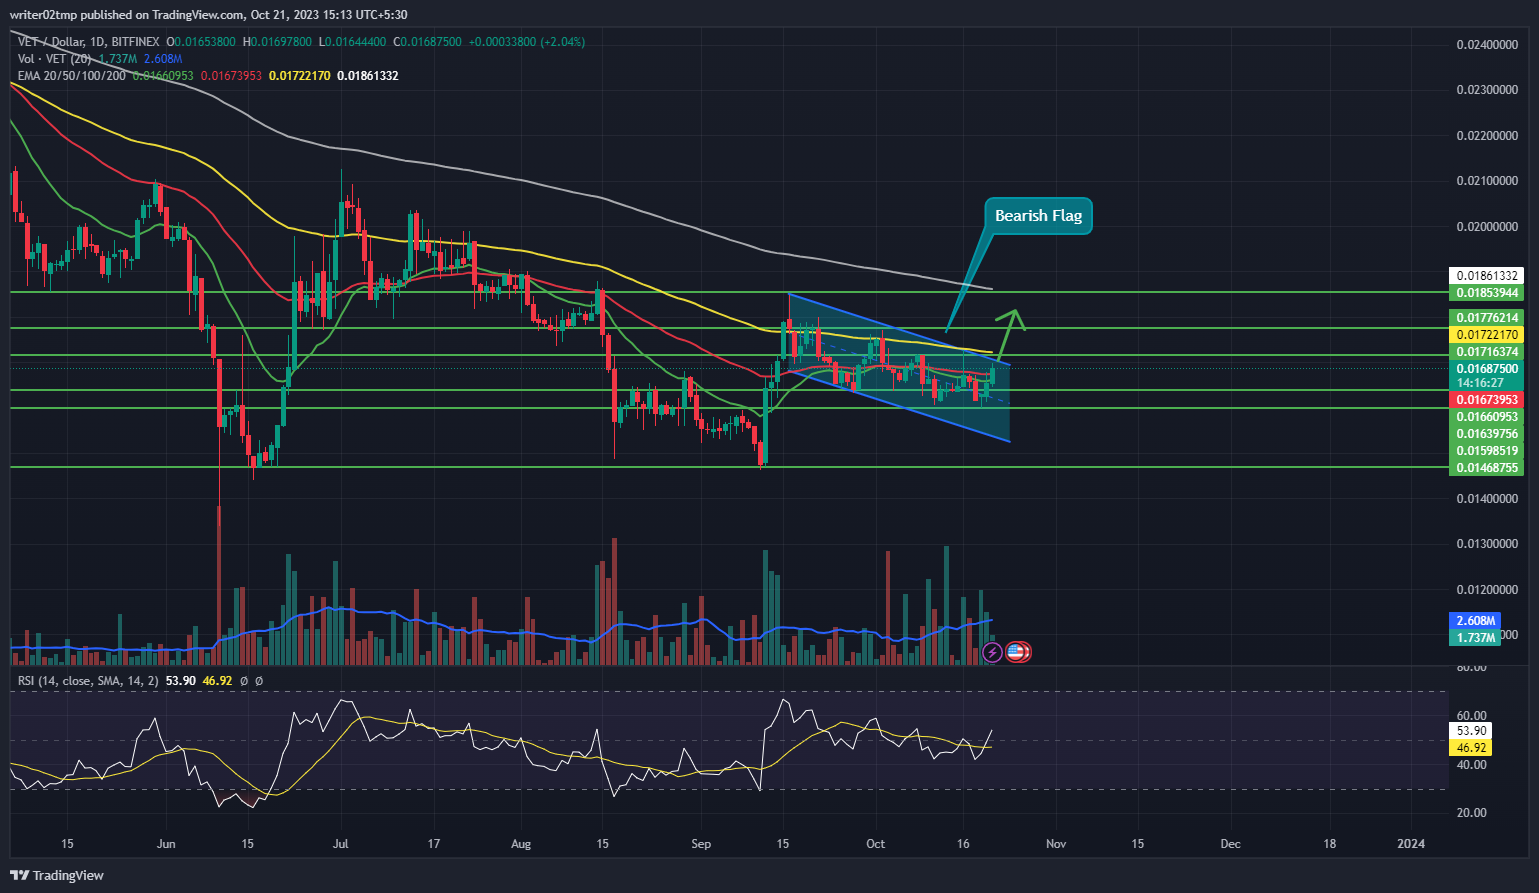
VeChain price prediction suggests that VET may break out from the declining channel as it trades in a bullish flag pattern. Bullish flag pattern implies a breakout of VET crypto over the daily time frame chart. The spikes from September shows the pole of the bullish flag and that the declining channel is the flag. The breakout doesn’t necessarily require a substantial increase in trading volume, but analysts and traders generally prefer it as it suggests that investors and other traders are showing renewed interest in the stock.
An upward breakout may be possible if VeChain crypto sustains at the upper trendline of the declining parallel channel. However, VET crypto may surge maximum as it breaks out of the declining pattern.
VeChain price was at $0.01685000 and gained 1.89% of its market capitalization intraday. However, trading volume fell by 6.57% during the intraday trading session. This demonstrates that sellers are still present in the trade to pull VET down. Volume to market cap ratio was at 2.28%.
VeChain May Skyrocket After Breakout
VeChain price prediction indicates the upward momentum of VET crypto inside the falling pattern. The cryptocurrency has been trying to break out of the declining pattern but failed to sustain at the upper trendline of the parallel channel. However, trading volume highlights a low accumulation rate by the buyers. Meanwhile, VET crypto recovered above 20 and 50-EMAs to reach the 100 and 200-days daily moving averages.
VET crypto may surge significantly after breaking out of the declining parallel channel or flag pattern. However, buyers need to accumulate to push VET crypto upwards during the day’s trading session because volume change is below average.
VET crypto price gained around 2.82% in a week while slipped by 4.91% in a month. Moreover, VET crypto declined by 12.57% in the last three months and 23.85% in the last six months. VeChain cryptocurrency managed to gain around 6.68% year to date. This confirms the facts regarding VET crypto’s recovery in 2023.
Technical indicators suggest the upward momentum of VET crypto. Relative strength index (RSI) confirms the recovery of VET crypto. RSI was at 53 and is heading towards the overbought territory. Investors in VeChain cryptocurrency need to wait until VET crypto price breaks out of the upper trendline of the declining parallel channel.
Summary
VeChain price prediction indicates that VET may break out from the declining channel as it trades in a bullish flag pattern. The spikes from September show the pole of the bullish flag and the declining channel is the flag. However, trading volume shows the lower accumulation rate of buyers during the intraday trading session. VeChain cryptocurrency managed to gain around 6.68% year to date. Technical indicators suggest the upward momentum of VET crypto.
Technical Levels
Support Levels: $0.01641451 and $0.01623890
Resistance Levels: $0.01718082 and $0.01853944
Disclaimer
The views and opinions stated by the author, or any people named in this article, are for informational purposes only, and they do not establish financial, investment, or other advice. Investing in or trading crypto or stock comes with a risk of financial loss.

With a background in journalism, Ritika Sharma has worked with many reputed media firms focusing on general news such as politics and crime. She joined The Coin Republic as a reporter for crypto, and found a great passion for cryptocurrency, Web3, NFTs and other digital assets. She spends a lot of time researching and delving deeper into these concepts around the clock, and is a strong advocate for women in STEM.


