
 Home
Home News
News

- 1 In the weekly and monthly time frame, GM stock price fell over 2% and 10%, respectively.
- 2 General Motors Company lost more than 16% market capitalization in 2023.
- 3 The reported revenue of the company for Q2 2023 was 3.88% greater than the estimates.
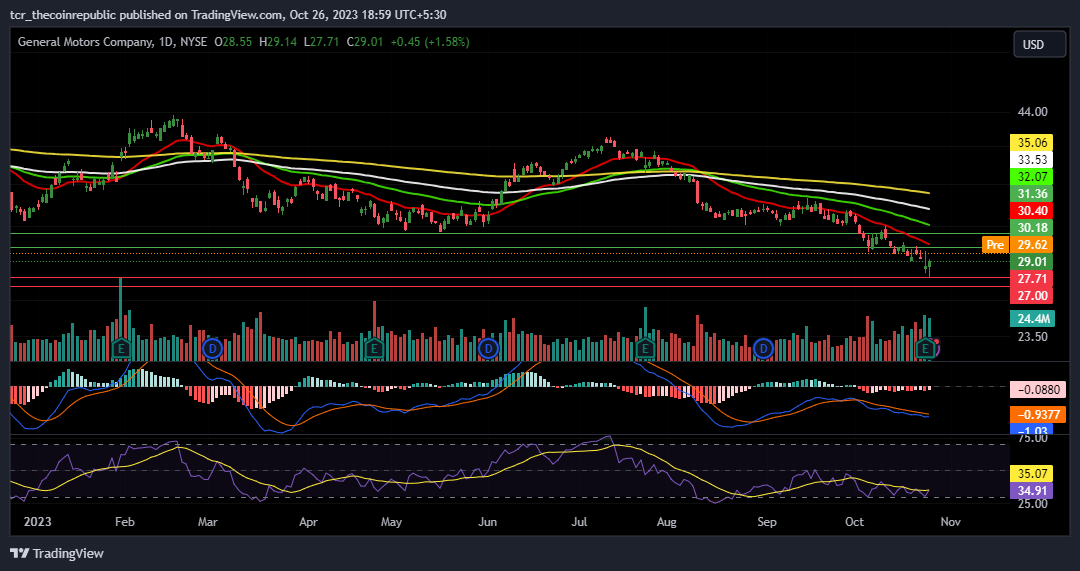
GM stock price has been declining over the past few month. It lost 2.78% over the weekly time frame and 10.41% over the month. When writing, the stock was trading below 20, 50, 100 and 200 day EMAs.
General Motors Company (GM) Stock Price Analysis
In the 52 weeks time frame, General Motors stock price peaked at $43.63 and its lowest trading price was $27.17. The MACD and signal line are in the bears’ region and seem to be penetrating deeper.

The RSI line is moving just above the bearish region and if the motion continues in the region, then more decline is expected. The annual price target of GM stock is $45.67, the target is 57.43% greater than its press time trading price.
In the year to date time frame, GM stock price fell over 14.71% and in the 52 weeks time frame, a sharp decline of 20.41% was observed.
General Motors Company has a market capitalization of $39.729 Billion, companiesmarketcap(dot)com data shows a decline of 16.87% in 2023. TradingView data states that 1.366 Billion GM shares are free floating and remaining 2.983 Million are closely held.
General Motors Company Financial Updates
The reported revenue of the company was 3.88% greater than the estimated figures, the company was supposed to report $42.48 Billion in revenue however its revenue was $44.13 Billion.
The estimated EPS of the company for Q2 2023 was positive $1.87, although the reported EPS was positive $2.28. In the financial year 2022, the reported revenue of General Motors Company was $156.74 Billion from which net income was $9.93 Billion and profit margin was positive 6.34%.
In the long term, total liabilities of the company are $100.58 Billion and its assets are $163.59 Billion. The company’s revenue is combined revenue from its other units such as GM North America, GM International, GM Financial, Corporate and Cruise.
It operates in the United States including several other nations globally. General Motors Co. engages in the designing, manufacturing, and selling of trucks, crossovers, cars, and automobile parts and in providing software-enabled services and subscriptions.
Technical Levels
Support Level: $27.71 & $27.00
Resistance Level: $30.18 & $31.36
Conclusion
General Motors Company stock lost over 10% of its trading price in a month. The MACD and signal line are in the bearish region and are yet to show any signs of a recovery.
Disclaimer
The views and opinions stated by the author or any people named in this article are for informational ideas only and do not establish financial, investment, or other advice. Investing in or trading crypto or stock comes with a risk of financial loss.

Nancy J. Allen is a crypto enthusiast, with a major in macroeconomics and minor in business statistics. She believes that cryptocurrencies inspire people to be their own banks, and step aside from traditional monetary exchange systems. She is also intrigued by blockchain technology and its functioning. She frequently researches, and posts content on the top altcoins, their theoretical working principles and technical price predictions.


