
 Home
Home News
News
- 1 The Graph price prediction showcases that the rally in GRT crypto has just begun.
- 2 GRT price attempting to break out of the 200-day EMA.
- 3 GRT crypto witnessed a massive spike in the buying volume.
The Graph price prediction showcases that the correction has halted and GRT crypto is getting ready for a massive rally.
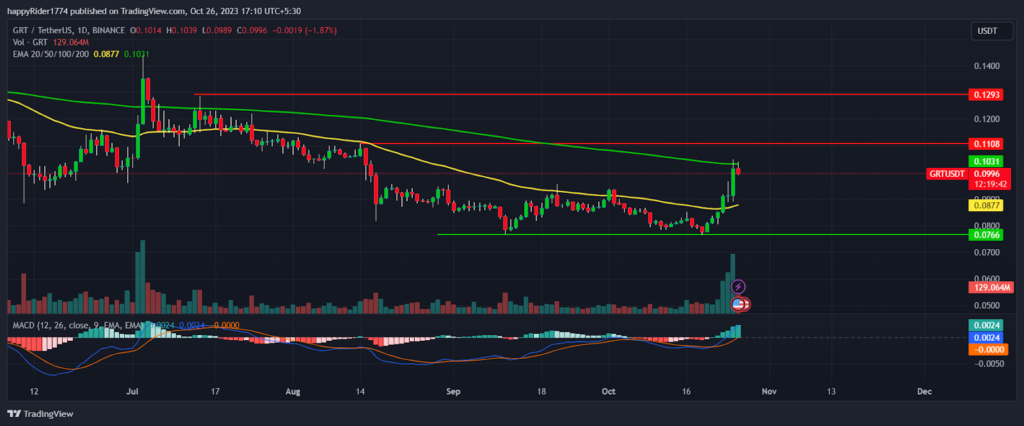
GRT price recovered 33% (approx.) from the recent swing low at $0.0766. It managed to climb above the 50-day EMA indicating the short-term trend has reversed upward.

At present, GRT price is attempting to break the 200-day EMA, so if buyers succeed then be prepared for a sharp rise.
Meanwhile, the buying volume in the GRT crypto witnessed a massive surge and prices followed the same direction. It showed that some crypto whales might have turned bullish and were expecting an outperformance in the coming months.
In the last two months, GRT crypto consolidated in the narrow range between $0.0766 to $0.0900. Recently, GRT price breakout of the higher range and expanded upward. It triggered the positive sentiment and fueled the rally.
The recent upmove in the Graph crypto looks reliable and prices are likely to hold the higher levels. At the time of writing, the Graph price is trading at $0.0996 with an intraday decline of -1.87%. The 24-hour volume to market cap is 12.14%.
Will The Graph Price Continue to Rise in November?
The Graph price prediction is bullish for the long term and suggests a rise. The price pattern of GRT is bullish and suggests buyers are returning back to the track.
On the higher side, $0.1108 will act as an immediate hurdle for the bulls. If the positive momentum continues and buyers succeed in breaking the $0.1108 hurdle, the 10% to 15% more upside will open.
On the other hand, if the GRT price faces rejection from $0.1108 then it may retrace back to the 50-day EMA. The analysis suggests GRT price is on buyers’ radar and recovery is likely to continue in November.
GRT Price Displayed a Bullish Engulfing Candle
GRT price rose 17.14% in the current week and displayed a bullish engulfing candle. It engulfed the losses of the past nine weeks and boosted the confidence of long-term investors.
Meanwhile, the crypto leader BTC and ETH price is performing well so the positive waves of the overall markets will impact the GRT crypto as well.
The RSI at 71 denotes overbought territory so minor retracement may come. However, the price action and MACD curve suggest bullish momentum will continue in the coming week.
Conclusion
The Graph price prediction showcases that a rally in the GRT crypto will continue in November. The recent upmove in the GRT price looks reliable and is supported by genuine buying. Therefore, bulls are active, and more upside in GRT is pending.
Technical levels
- Resistance levels: $0.1108 and $0.1293
- Support levels: $0.0800 and $0.0766
Disclaimer
The views and opinions stated by the author, or any people named in this article, are for informational purposes only. They do not establish financial, investment, or other advice. Investing in or trading crypto assets comes with a risk of financial loss.
Mr. Pratik chadhokar is an Indian Forex, Cryptocurrencies and Financial Market Advisor and analyst with a background in IT and Financial market Strategist. He specialises in market strategies and technical analysis and has spent over a year as a financial markets contributor and observer. He possesses strong technical analytical skills and is well known for his entertaining and informative analysis of the Financial markets.


