
 Home
Home News
News
- 1 WEC stock is trying to escape the 20 day EMA barrier to gain strength.
- 2 Buyers are gaining traction and held the gains amid bearishness.
WEC Energy Group Inc. (NYSE: WEC) WEC stock price has surpassed the 20 day EMA and is gaining momentum ahead of the Q3 earnings results which will be posted on October 31st. WEC stock has corrected from the highs of $100 and has retested the demand zone of $75. Furthermore, the WEC stock rebounded vertically. However, buyers must sustain above the 20 day EMA hurdle to extend the rebound, otherwise, the $78 support could be retested.
WEC stock price is in a downtrend and persisted in forming lower lows and stayed below the neutral territory. However, the price action showcased that buyers are gaining momentum and are looking to flip the trend, whereas, to beat the mighty bears, bulls must escape the 50 day EMA where sellers have maintained a strong grip. Per the options chain, at the strike price of $80, a massive open interest of 2241 hundred shares on the put side indicates the immediate strong support zone, whereas $85 is the immediate resistance zone.
At press time, WEC stock price was $82.32 with an intraday gain of 0.91%. Moreover, trading volume increased by 0.44% to 1.67 Million while the market cap is $25.967 Billion. However, analysts maintained a neutral rating with a yearly target price of $90.31 suggesting that the underperformance will continue in the upcoming sessions.
WEC Energy Group, Inc. is a holding company, which engages in the generation and distribution of electricity and natural gas. It operates through the following segments: Wisconsin, Illinois, Other States, Electric Transmission, Non-Utility Energy Infrastructure and Corporate & Other. The Wisconsin segment refers to the electric and gas utility operations. The Illinois segment deals with natural gas utility and non-utility activities. The Other States segment pertains to natural gas operations of the firm’s subsidiaries. The company was founded in 1981 and is headquartered in Milwaukee, WI.
Will WEC Stock Surpass Immediate Resistance Zone of $90?
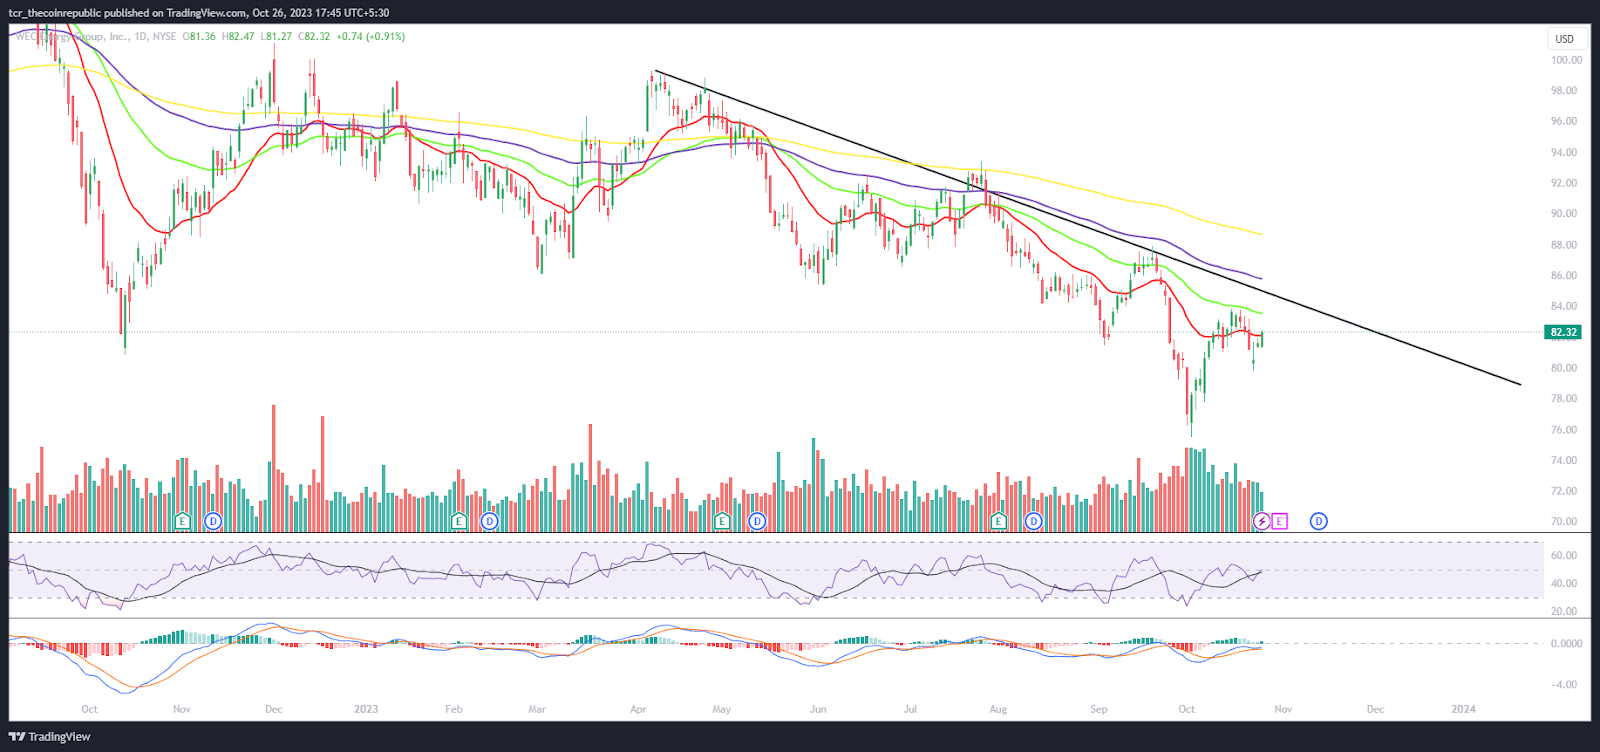
On the daily chart, WEC stock price is close to the 20 day EMA and has pulled back. Furthermore, a vertical recovery was noted from the bottom of $75 and buying interest was witnessed. Moreover, the WEC stock price is close to the 38.2% Fibonacci retracement zone and is close to the mid bollinger band.
The RSI curve stayed near neutrality and formed a bearish divergence indicating that volatility will continue in the upcoming sessions. The green bars on the MACD suggest a positive outlook.
Summary
WEC stock price has showcased a vertical rebound from the bottom at $75. The price action highlights long buildup activity ahead of the Q3 results.
Technical Levels
Support Levels: $78 and $70
Resistance Levels: $85 and $90
Disclaimer
The views and opinions stated by the author or any other person named in this article are for informational purposes only and do not constitute financial, investment, or other advice. Investing in or trading crypto or stocks comes with a risk of financial loss.
Steve Anderson is an Australian crypto enthusiast. He is a specialist in management and trading for over 5 years. Steve has worked as a crypto trader, he loves learning about decentralisation, understanding the true potential of the blockchain.


