
 Home
Home News
News
- 1 HD stock price slips below the crucial support zone of $280.
- 2 Buyers have lost their strength and unwind their long positions.
Home Depot Inc. (NYSE: HD) HD stock price witnessed selling pressure and has slipped below the crucial support zone of $280. Furthermore, the price action indicates the bears dominance and persisted in adding short positions. Furthermore, the chart delivers the breakdown and showcased the three black soldiers pattern which is a sign of bearishness. Moreover, HD stock is in a correction phase and bulls were not able to absorb the selling pressure and are in trouble. HD stock dropped over 18% from the $330.
HD stock price is below the significant moving averages due to the selling pressure. Furthermore, the price action indicates that the short build up activity resulted in a breakdown. Moreover, the options chain shows that, at the strike price of $280, open interest of 1110 hundred shares on the put side, whereas 147 hundred shares on the call side.(Nasdaq). This option chain shows that long positions were trapped amid a panic sell-off.
HD stock price is trading at $276.46 with an intraday drop of 0.55% at press time, suggesting neutrality. Furthermore, the trading volume increased by 0.55% to 2.90 Million and the market cap is $276.478 Billion. Analysts have maintained a growth outlook with buy rating with a yearly target price of $343.85.
Home Depot, Inc. engages in the sale of building materials and home improvement products. Its products include building materials, home improvement products, lawn and garden products and decor products. The firm operates through the following geographical segments: U.S., Canada and Mexico. It offers home improvement installation services, and tool and equipment rental. The company was founded by Bernard Marcus, Arthur M. Blank, Kenneth Gerald Langone and Pat Farrah on June 29, 1978, and is headquartered at Atlanta, GA.
Will HD Stock Sustain $275 or Extend Selloff?
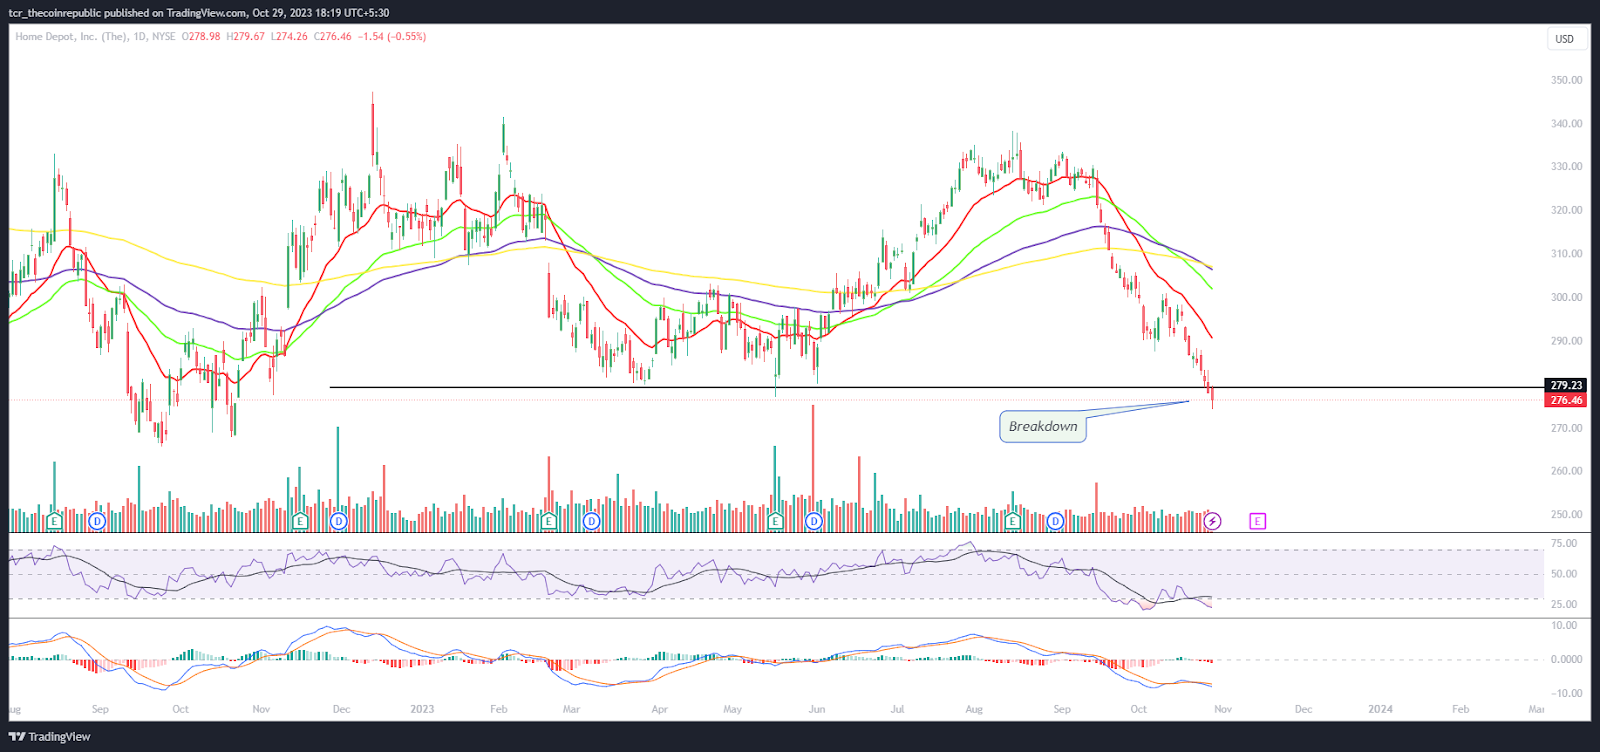
On the daily charts, HD stock price has slipped below the significant moving averages and broke down. Furthermore, the price action highlights the selling pressure from the top. Moreover, ahead of the Q3 earnings result, HD stock is in bearish territory. Buyers are trying to regain momentum, but failed.
The RSI curve is in the oversold region and the bearish divergence suggests that follow-on selling will continue and HD stock will retest $250 in the upcoming sessions. The MACD indicator shows a bearish crossover and red bars on the histogram suggesting a negative outlook.
Summary
HD stock price is trading below the significant moving averages and broke down in the past trading sessions. The price action highlights bearish dominance and underperformance. However, the buyers are trapped now and are trying to hold the cluster of $275 which is a make or break zone.
Technical Levels
Support Levels: $275 and $265
Resistance Levels: $280 and $285
Disclaimer
The views and opinions stated by the author or any other person named in this article are for informational purposes only and do not constitute financial, investment, or other advice. Investing in or trading crypto or stocks comes with a risk of financial loss.
Steve Anderson is an Australian crypto enthusiast. He is a specialist in management and trading for over 5 years. Steve has worked as a crypto trader, he loves learning about decentralisation, understanding the true potential of the blockchain.


