



Micron Technology (NASDAQ: MU) MU stock price is showing narrow range moves and is hovering inside the symmetrical triangle pattern. Moreover, the price action showcased the higher highs and is trading close to the 200 day EMA support zone, although, sellers tried their best to smash the lower trendline. Furthermore, the chart shows that MU stock price is trading in the bullish trajectory giving a positive outlook.
MU stock price is trading near the lower trendline of the symmetrical triangle pattern and has rebounded from the 200 day EMA in yesterday’s trading session. Furthermore, the options chain shows that, at the strike price of $65, open interest of 1734 hundred shares on the put side, whereas 270 hundred shares on the call side (Nasdaq). This chain showcases long buildup activity.
At press time, MU stock price was $65.65 with an intraday gain of 1.74% showing neutrality on the charts. Moreover, the trading volume increased by 0.24% to 9.80 Million while the market cap is $72.086 Billion. Furthermore, analysts have maintained a buy rating with a yearly target price of $80.18, suggesting a growth outlook.
Micron Technology, Inc. engages in the provision of innovative memory and storage solutions. It operates through the following segments: Compute and Networking Business Unit (CNBU), Mobile Business Unit (MBU), Embedded Business Unit (EBU), and Storage Business Unit (SBU). The CNBU segment includes memory products and solutions sold into client, cloud server, enterprise, graphics, and networking markets. The MBU segment is involved in memory and storage products sold into smartphone and other mobile-device markets. The company was founded by Ward D. Parkinson, Joseph Leon Parkinson, Dennis Wilson, and Doug Pitman on October 5, 1978 and is headquartered in Boise, ID.
Will MU Stock Continue to Outperform?
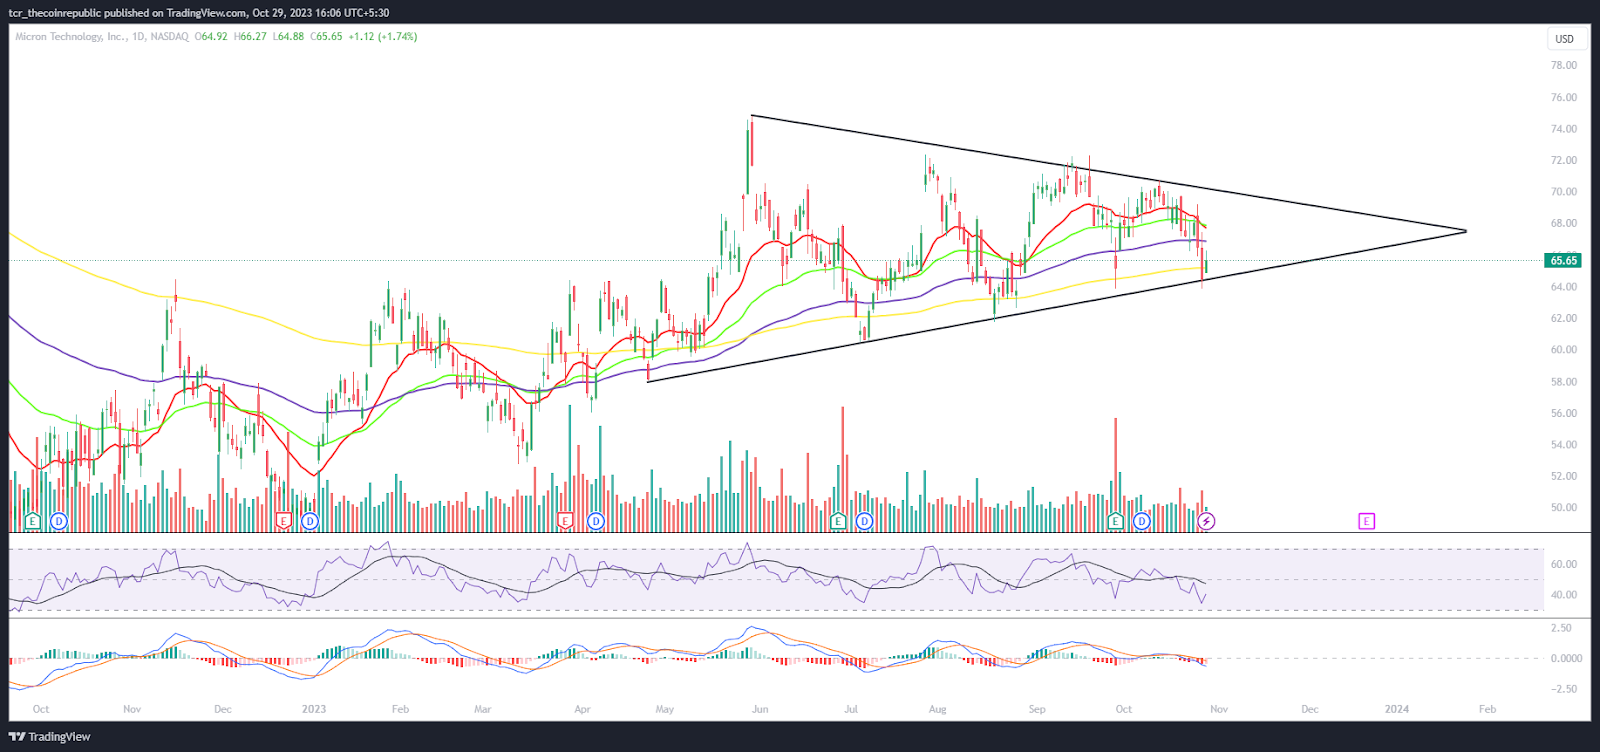
On the daily charts, MU stock price is trading in the bullish trajectory. The price action shows that MU stock has persisted in outperforming the market among its peers, decisively holding the gains amid the bearishness. Furthermore, the chart shows the higher highs formation and the symmetrical triangle pattern.
The RSI curve stayed in the oversold region and is forming a bullish divergence suggesting that MU stock will persist in outperforming for the upcoming sessions. The MACD shows a bearish crossover and red bars on the histogram, highlighting profit booking in the past sessions.
Summary
MU stock price is trading in the bullish trajectory and was in an uptrend. Furthermore, the chart shows the symmetrical triangle pattern and that MU stock decisively held the lower trendline, rebounding from the 200 day EMA support zone in the last session.
Technical Levels
Support Levels: $60 and $55
Resistance Levels: $70 and $75





