
 Home
Home News
News
- 1 KASPA Coin price has surged magnificently by over 1100% in 2023.
- 2 KAS Coin price has recently broken the rising wedge pattern on the daily time frame.
- 3 The current market price of the KASPA Coin is $0.064137.
Kaspa coin price has been in an uptrend since it got listed on the exchange. It has shown some consolidation during the initial phase of the trading, but it was over in November 2022. After this, the coin price has shown some remarkable upside from the lower level and bulls are aggressively riding in this token.
KASPA coin has outperformed the crypto market as the market has witnessed some selling pressure in the middle of the year. Most of the major cryptocurrencies are trading below the yearly high level that they created at the beginning of the year 2023. However, if we calculate the return of the coin in 2023, it is trading at over 1100% from the Year-to-date (YTD) level.
In the current trading session, the KASPA Coin price has shown a wild swing on the selling side. However, as the day progressed the coin price has recovered from the lower level and is forming a doji candle on the daily chart. It is currently trading with a decline of $0.000082 or 0.13%. The total amount of trading volume for the coin in the current trading session is $67,054,431.
A Quick Synopsis of the KASPA Coin Chart
Recently, The KAS coin price broke the rising wedge pattern and is looking super strong on the chart. The coin price has formed a higher high and higher low chart formation which confirms that the coin price is in an uptrend. If we observe the buyers’ strength through the chart, they are looking more aggressive and are absorbing the liquidity with ease.
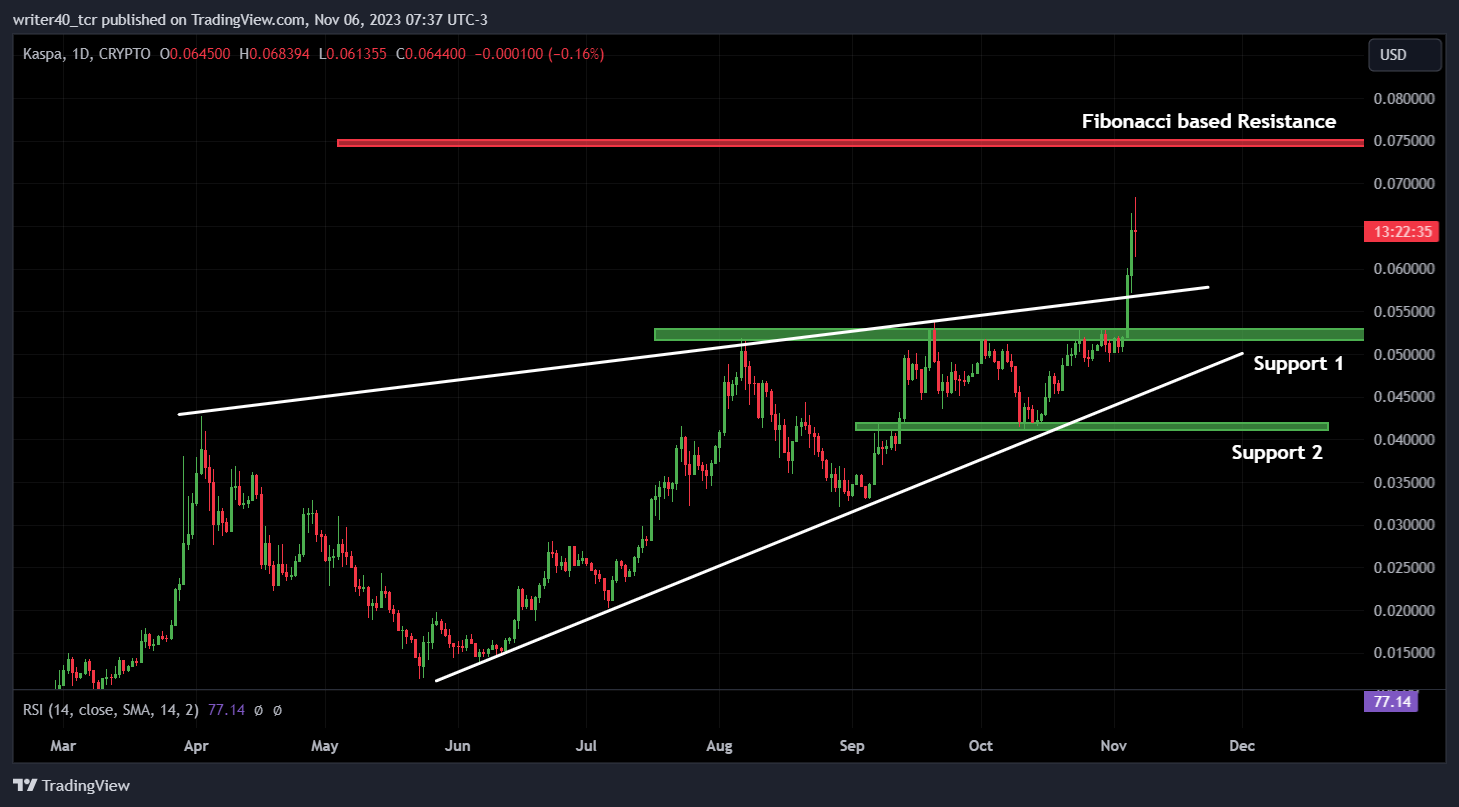
KAS coin’s price recently breached the resistance level of $0.052791 and has been retracing back multiple times. The bulls have taken control of this level and making it support for the price. The other support is present near the recent swing low of $0.040997. Considering, the resistance level, the price is trading at an all-time high and there is no resistance left for the coin. However, according to the Fibonacci tool, the Kaspa coin price can face resistance near the level of $0.07424.
Are EMA and RSI Bullish or Bearish for the KASPA Coin Price?
The KAS coin price is trading well above the 50-day and 200-day exponential moving averages. It has been successfully defended the 50-day EMA since July 2023. However, the sellers have tried to take control of both the EMAs but have failed to do so.
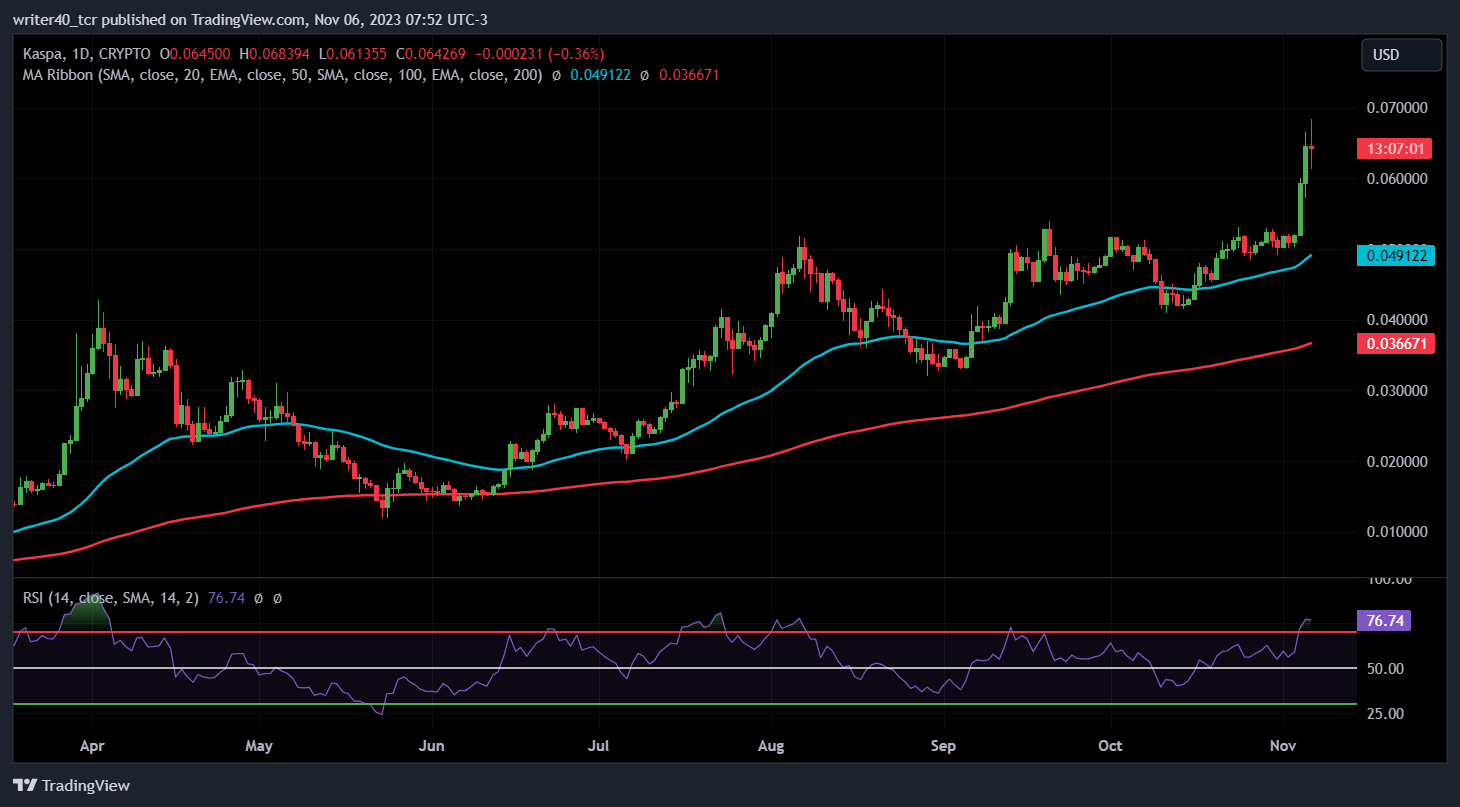
The relative strength index (RSI) is currently curving at 76.74. It indicates that the price is now overbought and needs some time to cool off before resuming the uptrend. However, the coin price can still go up before any correction.
Conclusion
The Kaspa coin price is looking super strong and the chart structure of the coin is bullish. It has outperformed the market in the past and is expected that it can continue to surge ahead.
Technical Level
Resistance Level- $0.07424
Support Level- $0.052791 and $0.040997
Disclaimer
The views and opinions stated by the author, or any people named in this article, are for informational purposes only. They do not establish financial, investment, or other advice. Investing in or trading crypto assets comes with a risk of financial loss.
Steve Anderson is an Australian crypto enthusiast. He is a specialist in management and trading for over 5 years. Steve has worked as a crypto trader, he loves learning about decentralisation, understanding the true potential of the blockchain.


