
 Home
Home News
News

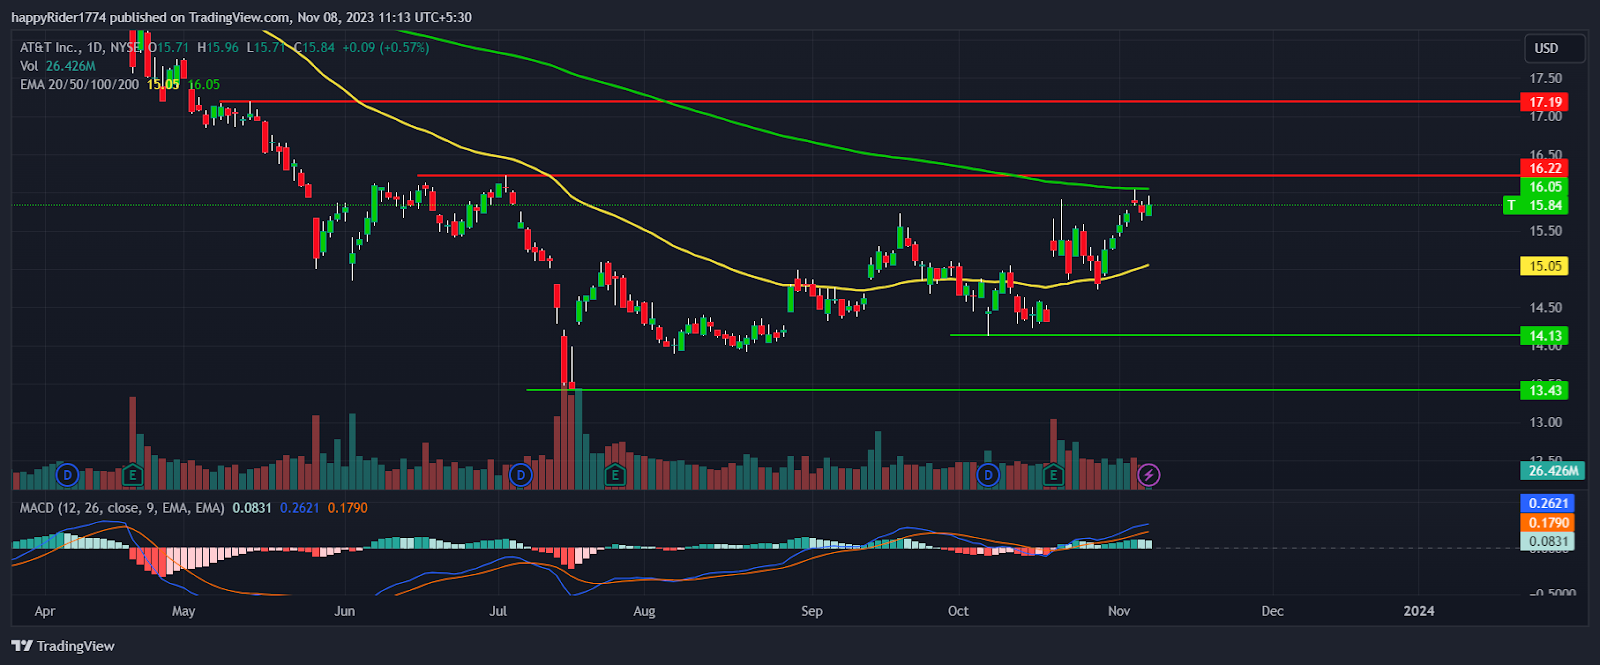
- 1 AT&T stock price defended $15.00 support and showed a minor recovery of 8% approx.
- 2 T stock price attempting to break out of the 200-day EMA.
- 3 The share price of AT&T Inc. is showing initial signs of a bullish trend reversal.
AT&T stock price took support near $15.00 and succeeded in holding the gains generated after the release of earnings. It formed a bullish reversal pattern and created a positive hope for long-term investors.
T stock price managed to sustain above the 50-day EMA indicating bulls are getting active. Moreover, prices are now approaching the 200-day EMA which is acting as an immediate hurdle.

If buyers of AT&T Inc. succeed in breaking out of the 200-day EMA hurdle. Then confirmation of a bullish trend reversal may be visible.
AT&T Inc. released the Q3 earnings of October 19, 2023. It reported an EPS of $0.64 and revenue of $30.35 Billion. The company beat the EPS as well as the revenue estimates by 3.15% and 0.48% respectively.
Investors reacted positively and stock prices gap up 6% in a single day. Later, T stock price consolidated for a few days and displayed signs of short-term base formation. At present, buyers’ dominance is visible and bulls are leading the rally.
T stock price closed the previous session at $15.84 with an intraday rise of 0.57%. The market capitalization stands at $113.26 Billion.
Will AT&T Stock Price Continue the Recovery in November?
AT&T stock price is in a recovery phase and bulls look more aggressive as compared to bears. Moreover, the broader market indices are also recovering which has positively impacted the T stock in the short run.
Till the share price sustains above $14.13 the bulls will remain active and minor corrections may get easily absorbed. The price action shows that the recent upmove looks reliable.
However, until the price breakout of the $16.00 hurdle, it will lack positive momentum. The analysis suggests, that in November T stock price will spend time in consolidation.
Will the T Stock Price Give Follow-Up Momentum?
T stock price rose 7% in the previous week and formed a bullish engulfing candle. At present price is near the supply zone. So, it will be interesting to see whether the buyers can give the follow-up momentum or not.
The MACD curve slopes upward and the histogram bar is green. It showcases the strength and confidence of bulls. The RSI at 61 also slopes upward denotes bulls are active and more room for upside is open.
Conclusion
AT&T stock price has shown a decent recovery from the recent swing low and sustained above the $15.00 level. At present, the price is near the supply zone at $16.00. So until it gets broken, the price will lack momentum.
The analysis suggests that T stock might face rejection from the $16.00 level and retrace down to the 50-day EMA.
Technical Levels
- Resistance levels: $16.22 and $17.19
- Support levels: $14.13 and $13.43
Disclaimer
The views and opinions stated by the author, or any people named in this article, are for informational purposes only. They do not establish financial, investment, or other advice. Investing in or trading crypto assets comes with a risk of financial loss.
Steve Anderson is an Australian crypto enthusiast. He is a specialist in management and trading for over 5 years. Steve has worked as a crypto trader, he loves learning about decentralisation, understanding the true potential of the blockchain.


