
 Home
Home News
News
- 1 BABCOCK stock price is currently trading at 389.2 GBX with a rise of 0.15% in the last 24 hours.
- 2 BAB has a current market cap of $1.962 Billion.
BABCOCK price action indicates bullishness, as BAB stock keeps the gains on the upper side in the bullish zone and ignores the rejections. The bears are still making short positions and trying to cause a pullback in the stock.
BABCOCK stock is showing bullishness and has held on to the gains above the 50 EMA level. Bulls are accumulating the stock and getting ready to cross the higher levels in the coming sessions.

The chart formation highlights the bulls’ momentum and signals a positive outlook on the charts. BAB stock is aiming to break out, and investors are watching it closely.
The price action shows a strong chart structure with buyers’ dominance, and long buildup activity was noted in the past trading sessions. Furthermore, sellers were now becoming cautious due to the vertical rally that trapped sellers in the past weeks.
BABCOCK ‘s price was at 389.2 GBX and gained 0.15% of its market capitalization during the day’s trading session. The last 24-hour trading volume was 56.987K and the last 10 days’ average trading volume is 680.127K. This demonstrates that buyers are trying to accumulate in order to surge toward the upper price range.
Technical Analysis of BABCOCK Stock Price in 1-D Time Frame
BABCOCK (LSE: BAB) has steadily seen its stock price rise for the past three months, gaining 1.94% and 21.75% in the six months. Currently, BAB stock is trying to hold on to this level after an unexpected surge in price.
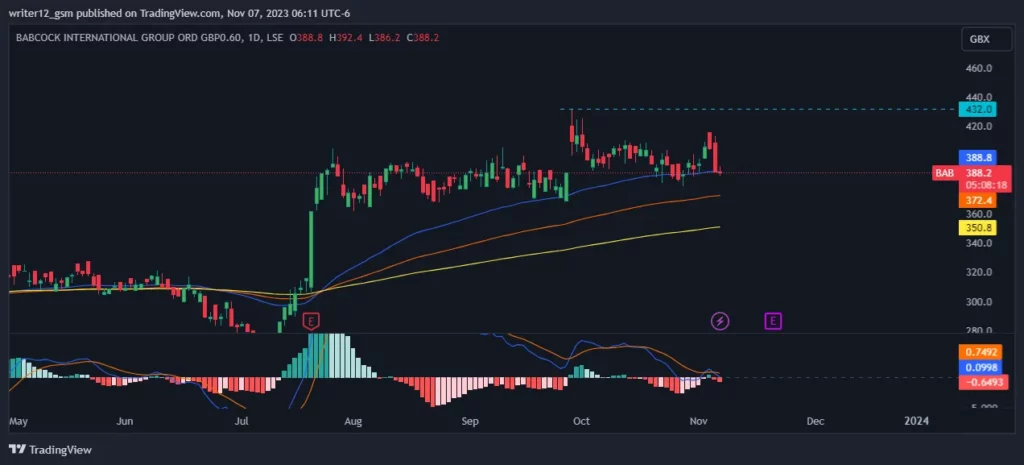
Currently, BABCOCK stock (LSE: BAB) is trading above the 50 and 200-day EMAs (exponential moving averages), which are supporting the price momentum.
The current value of RSI is 45.87 points. The 14 SMA is close to the median line at 48.96 points which indicates that the BABCOCK stock is neutral.
The MACD line at 0.0998 and the signal line at 0.7492 are above the zero line. A bearish crossover is observed in the MACD indicator which signals weakness in the momentum of the BAB stock price.
Weekly-Time Horizon Analysis
BABCOCK stock has shown buyers’ strength on the weekly charts. Moreover, the price traded above the key EMAs, which shows further strength in the stock. The RSI curve is near the overbought region at 57, and a positive outlook was noted, indicating bullishness in the stock. The MACD indicator also persisted to form green bars, and a bullish crossover was noted, which signals bullish moves.
Summary
BABCOCK stock (LSE: BAB) technical oscillators support the bullish trend. The MACD, RSI, and EMAs are emphasizing positive signs and imply that the uptrend may continue in the BAB stock price. Price action suggests that the investors and traders are bullish on the 1-day time frame. The price action reflects a bullish perspective at the moment.
Technical Levels
Support Levels: 372.4 GBX and 350.8 GBX.
Resistance Levels: 432.0 GBX and 450 GBX.
Disclaimer
This article is for informational purposes only and does not provide any financial, investment, or other advice. The author or any people mentioned in this article are not responsible for any financial loss that may occur from investing in or trading. Please do your own research before making any financial decisions

Andrew is a blockchain developer who developed his interest in cryptocurrencies while pursuing his post-graduation major in blockchain development. He is a keen observer of details and shares his passion for writing, along with coding. His backend knowledge about blockchain helps him give a unique perspective to his writing skills, and a reliable craft at explaining the concepts such as blockchain programming, languages and token minting. He also frequently shares technical details and performance indicators of ICOs and IDOs.


