
 Home
Home News
News
- 1 BCH price is facing headwinds now and exited below channel lows of $225.
- 2 Buyers are losing their momentum and are facing selloff.
Bitcoin Cash (BCH) price lost the buying momentum after the EDX delisting news, and now the sellers are gaining strength. Moreover, the BCH crypto price slipped below the rising channel and has split the 100-day EMA mark, witnessing selling pressure. BCH crypto was bullish due to the EDX listing news, but the craze did not last long, and the news turned into a threat and converted into delisting.
BCH crypto price is heading to the round mark of $200 and has shown a trend reversal from the swing of $270 and started to form lower lows. Technicals suggest that BCH crypto may face further selloff and retest the 200-day EMA near $200 soon. Additionally, if it slips below $200, it could go toward the demand zone of $150. The price action shows the erosion of bullishness, and BCH crypto experienced a selloff.
The live price of BCH crypto is $219.08, with an intraday drop of 3.90%, showing a breakdown in the past sessions. Moreover, the trading volume increased by 6.74% to $254.34 Million, and the market cap is $4.24 Billion. Analysts have maintained a neutral rating and suggest that BCH could reach a swing of $300 by the end of 2023.
Will BCH Crypto Hold Gains Above 200 Day EMA?
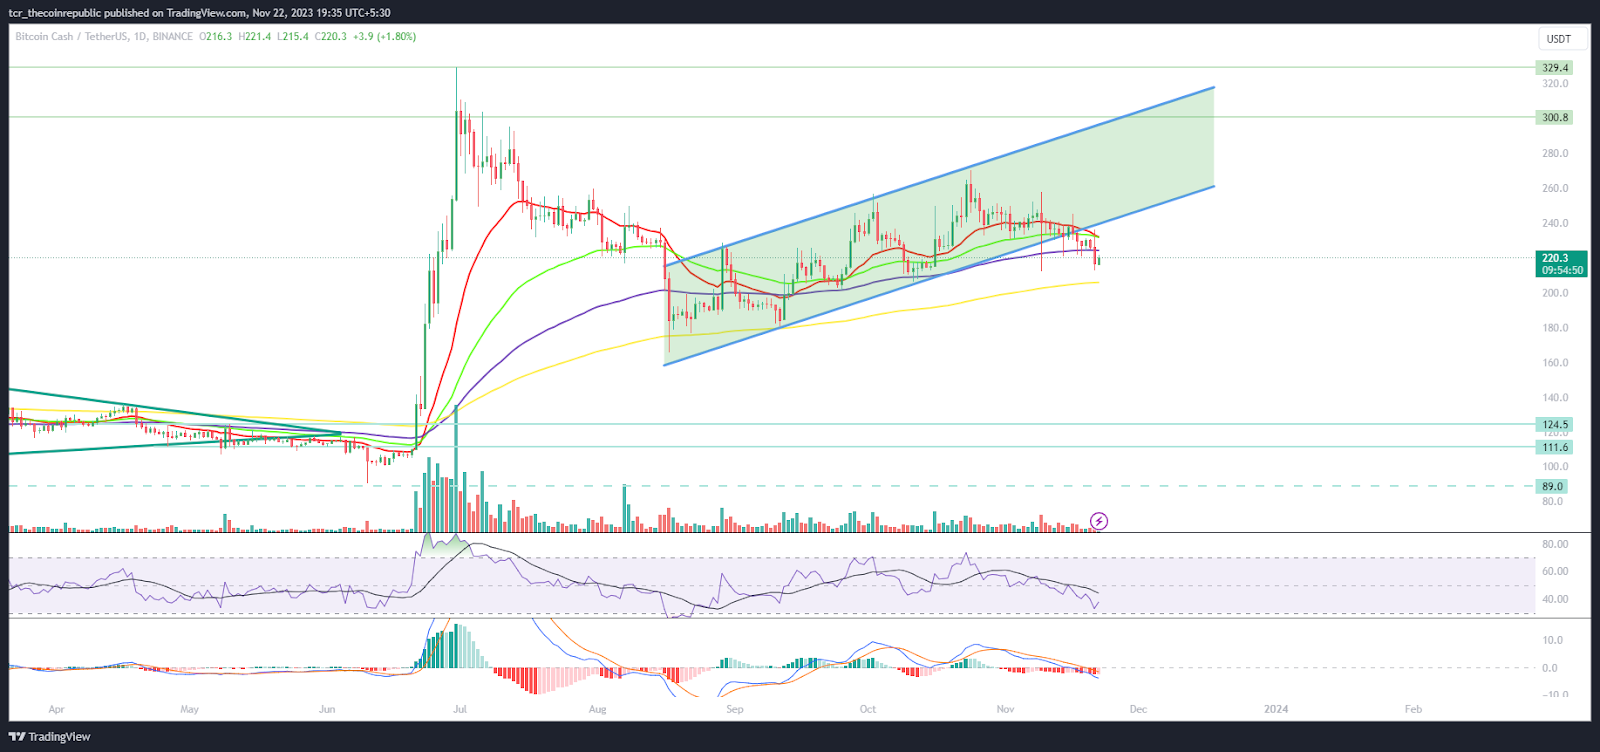
On the daily chart, BCH crypto price has exited the channel lows of $225 and is facing selling pressures. Moreover, the BCH crypto price failed to hold the gains near $250 and is heading to retest the 200-day EMA mark. The technicals show that BCH crypto may continue to extend the weakness per the bear dominance witnessed on the charts.
The RSI curve slipped below neutrality and noted a negative crossover, indicating the correction on the charts.
The MACD indicator showed a bearish crossover and formed red bars on the histogram, suggesting that BCH crypto will persist in facing a selloff and may retest $180 soon.
Weekly Charts Shows Pump and Dump Moves
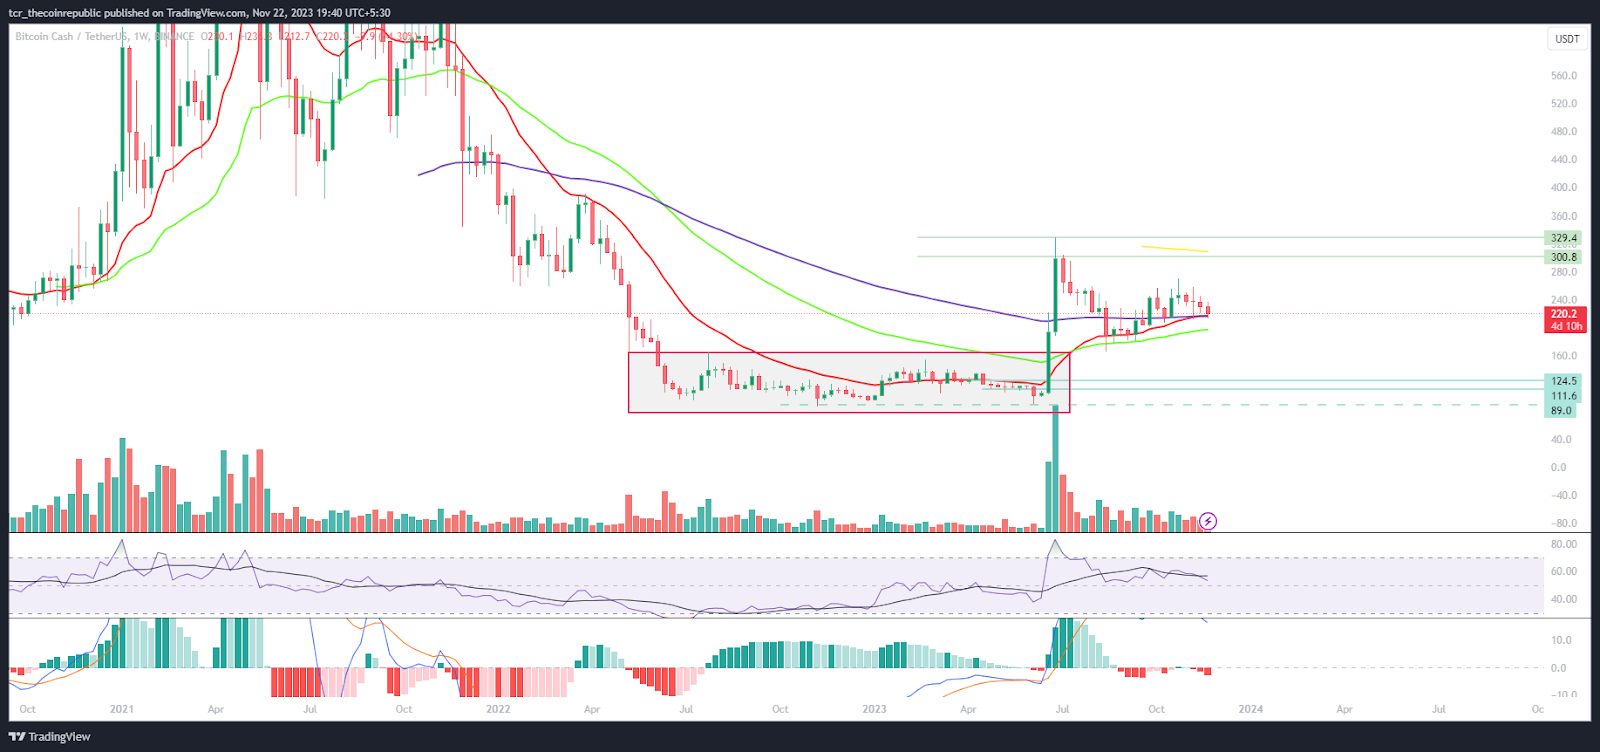
On the weekly chart, BCH crypto signals weakness and may extend bearishness to $200 in the following sessions due to the breakdown of the bearish flag pattern. Moreover, the price action shows buyers are on the backfoot and in trouble as per the sentimental impact. Conversely, the crypto market continues to rise, pumping the gains, but BCH is at the last in the row and faces headwinds.
Summary
Bitcoin Cash (BCH) price faced a turnaround and witnessed a channel breakdown, which highlights the selling pressure. Moreover, the BCH crypto has slipped below the 20, 50, and 100-day EMAs and is heading to the 200-day EMA near $200. Furthermore, the BCH crypto highlights seller dominance.
Technical Levels
Support Levels: $210 and $200
Resistance Levels: $230 and $250
Disclaimer
The views and opinions stated by the author or any other person named in this article are for informational purposes only and do not constitute financial, investment, or other advice. Investing in or trading crypto or stocks comes with a risk of financial loss.

Adarsh Singh is a true connoisseur of Defi and Blockchain technologies, who left his job at a “Big 4” multinational finance firm to pursue crypto and NFT trading full-time. He has a strong background in finance, with MBA from a prestigious B-school. He delves deep into these innovative fields, unraveling their intricacies. Uncovering hidden gems, be it coins, tokens or NFTs, is his expertise. NFTs drive deep interest for him, and his creative analysis of NFTs opens up engaging narratives. He strives to bring decentralized digital assets accessible to the masses.


