
 Home
Home News
News
- 1 Major exponential moving averages support the LINK price.
- 2 The LINK price has displayed a sign of revival as it bounced back from a critical level.
Chainlink is a network of decentralized oracles that provides real-world data to smart contracts on the Ethereum blockchain, enabling the creation of secure and reliable decentralized applications (DApps). LINK is the cryptocurrency token of the Chainlink network, used to pay for services within the ecosystem.
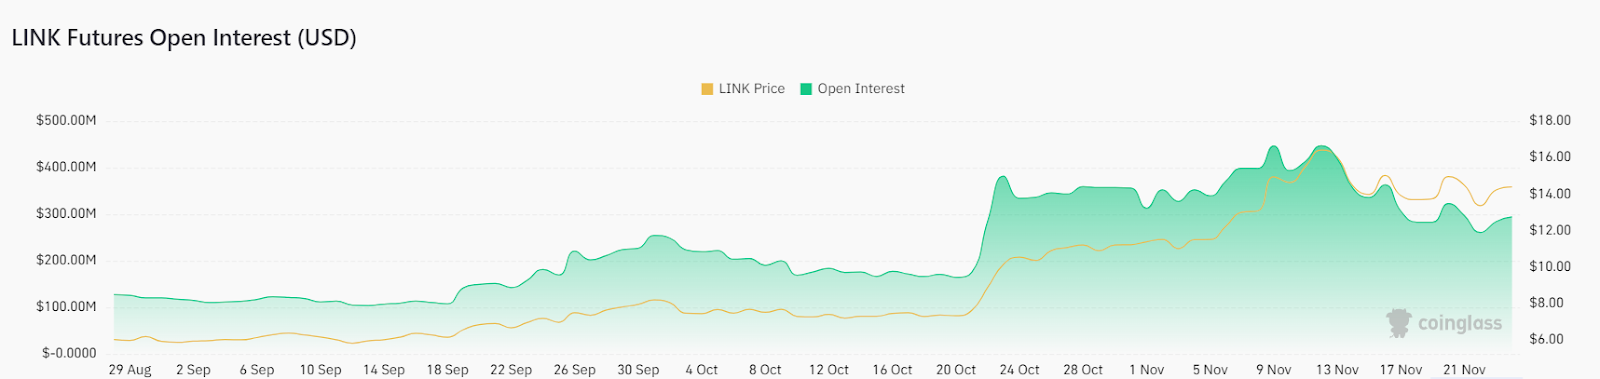
What the 3-Months LINK Open Interest Chart Shows
According to Coinglass, a cryptocurrency data analysis tool, open interest for Chainlink (LINK) is $294.31 million, down by 1.35% from the previous session.
The 24-hour long/short ratio is 0.9474, meaning there are more long positions than short positions. The total number of short positions that were opened in the last 24 hours is $245.26 thousand and long positions are $221.70 thousand.
The Coinglass website displays the LINK futures OI chart in USD. This shows that the OI generated was low in September and remained below about 180 Million. LINK lost momentum and remained at $6.00.
However, OI increased in October and November and remained above 180 Million. The price also rose by about $16 following the OI, highlighting upward momentum. So, if more OI is generated from LINK, another impressive rally could occur. It can break through resistance and take LINK to new heights.
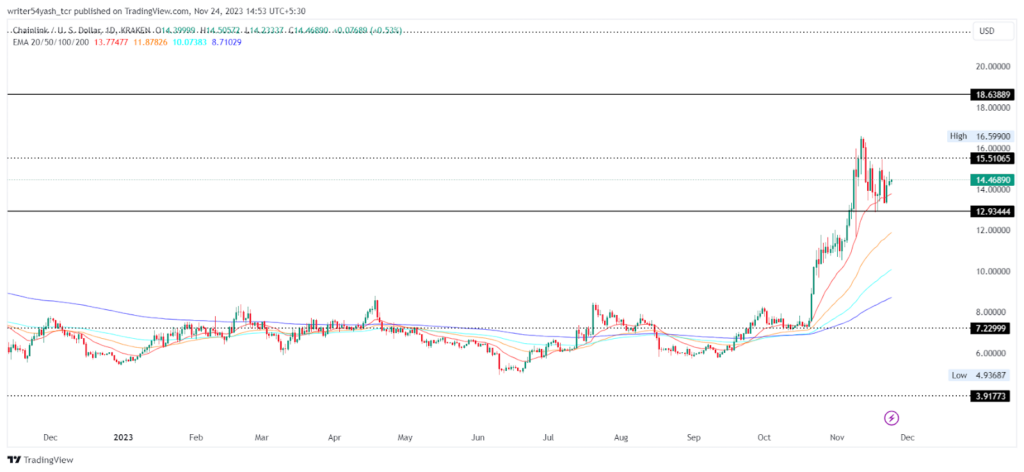
What LINK Price Chart Highlights
The LINK price blasted off in June 2023, climbed higher and higher, forming new highs and lows along the way. It demonstrated a remarkable 3x growth by November 2023.
Furthermore, it seems like the LINK crypto is primed for a phenomenal rally, as it builds up strength to blast through the barriers and zoom to new highs from the current base zone.
Currently, the LINK price is above all major EMAs and is trading at $14.49 with an intraday surge of 0..56%.
Therefore, if buyers sustain the pressure, LINK price might surge strongly from the current level. The possible target is $18.00. On the contrary, if LINK fails to hold its grip and breaches the $10.00 level, it may fall further.
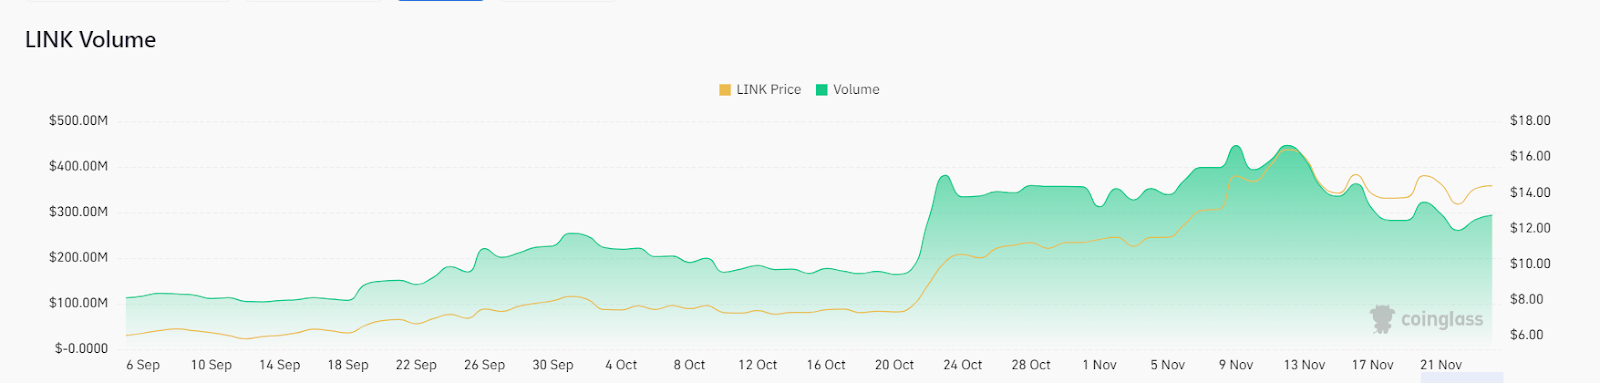
Volume Analysis
Looking at the chart, we can see that both asset volume and price were low in September. This implies a lack of interest and activity in the market. Volume was mostly under $150 Million and prices were around $6.
However, from October, volumes and prices continued to rise, indicating increased demand and excitement about LINK prices. Trading volume exceeded $200 Million and the price rose by about $16.
Volume and price were stable in November after a sharp rise. This indicates that the market price of LINK has now reached a stage of equilibrium between buyers and sellers. The chart also suggests that another trigger is needed for LINK volume and price to break out of this range.
Technical Levels
Support Levels: $10
Resistance Levels: $18
Disclaimer
In this article, the views, and opinions stated by the author, or any people named are for informational purposes only, and they don’t establish the investment, financial, or any other advice. Trading or investing in cryptocurrency assets comes with a risk of financial loss.

Nancy J. Allen is a crypto enthusiast, with a major in macroeconomics and minor in business statistics. She believes that cryptocurrencies inspire people to be their own banks, and step aside from traditional monetary exchange systems. She is also intrigued by blockchain technology and its functioning. She frequently researches, and posts content on the top altcoins, their theoretical working principles and technical price predictions.


